Telia Company Results Presentation Deck
FINLAND
N
3,302 3,233
Service revenues
Reported currency, in millions, like for like growth
-4.5%
●
●
3,085
3,231
Q1 20 Q2 20 Q3 20 Q4 20
Q1 21
■Consumer Enterprise Other
2,991
Adj EBITDA
Reported currency, in millions, like for like growth
-2.4%
1,156
1,223
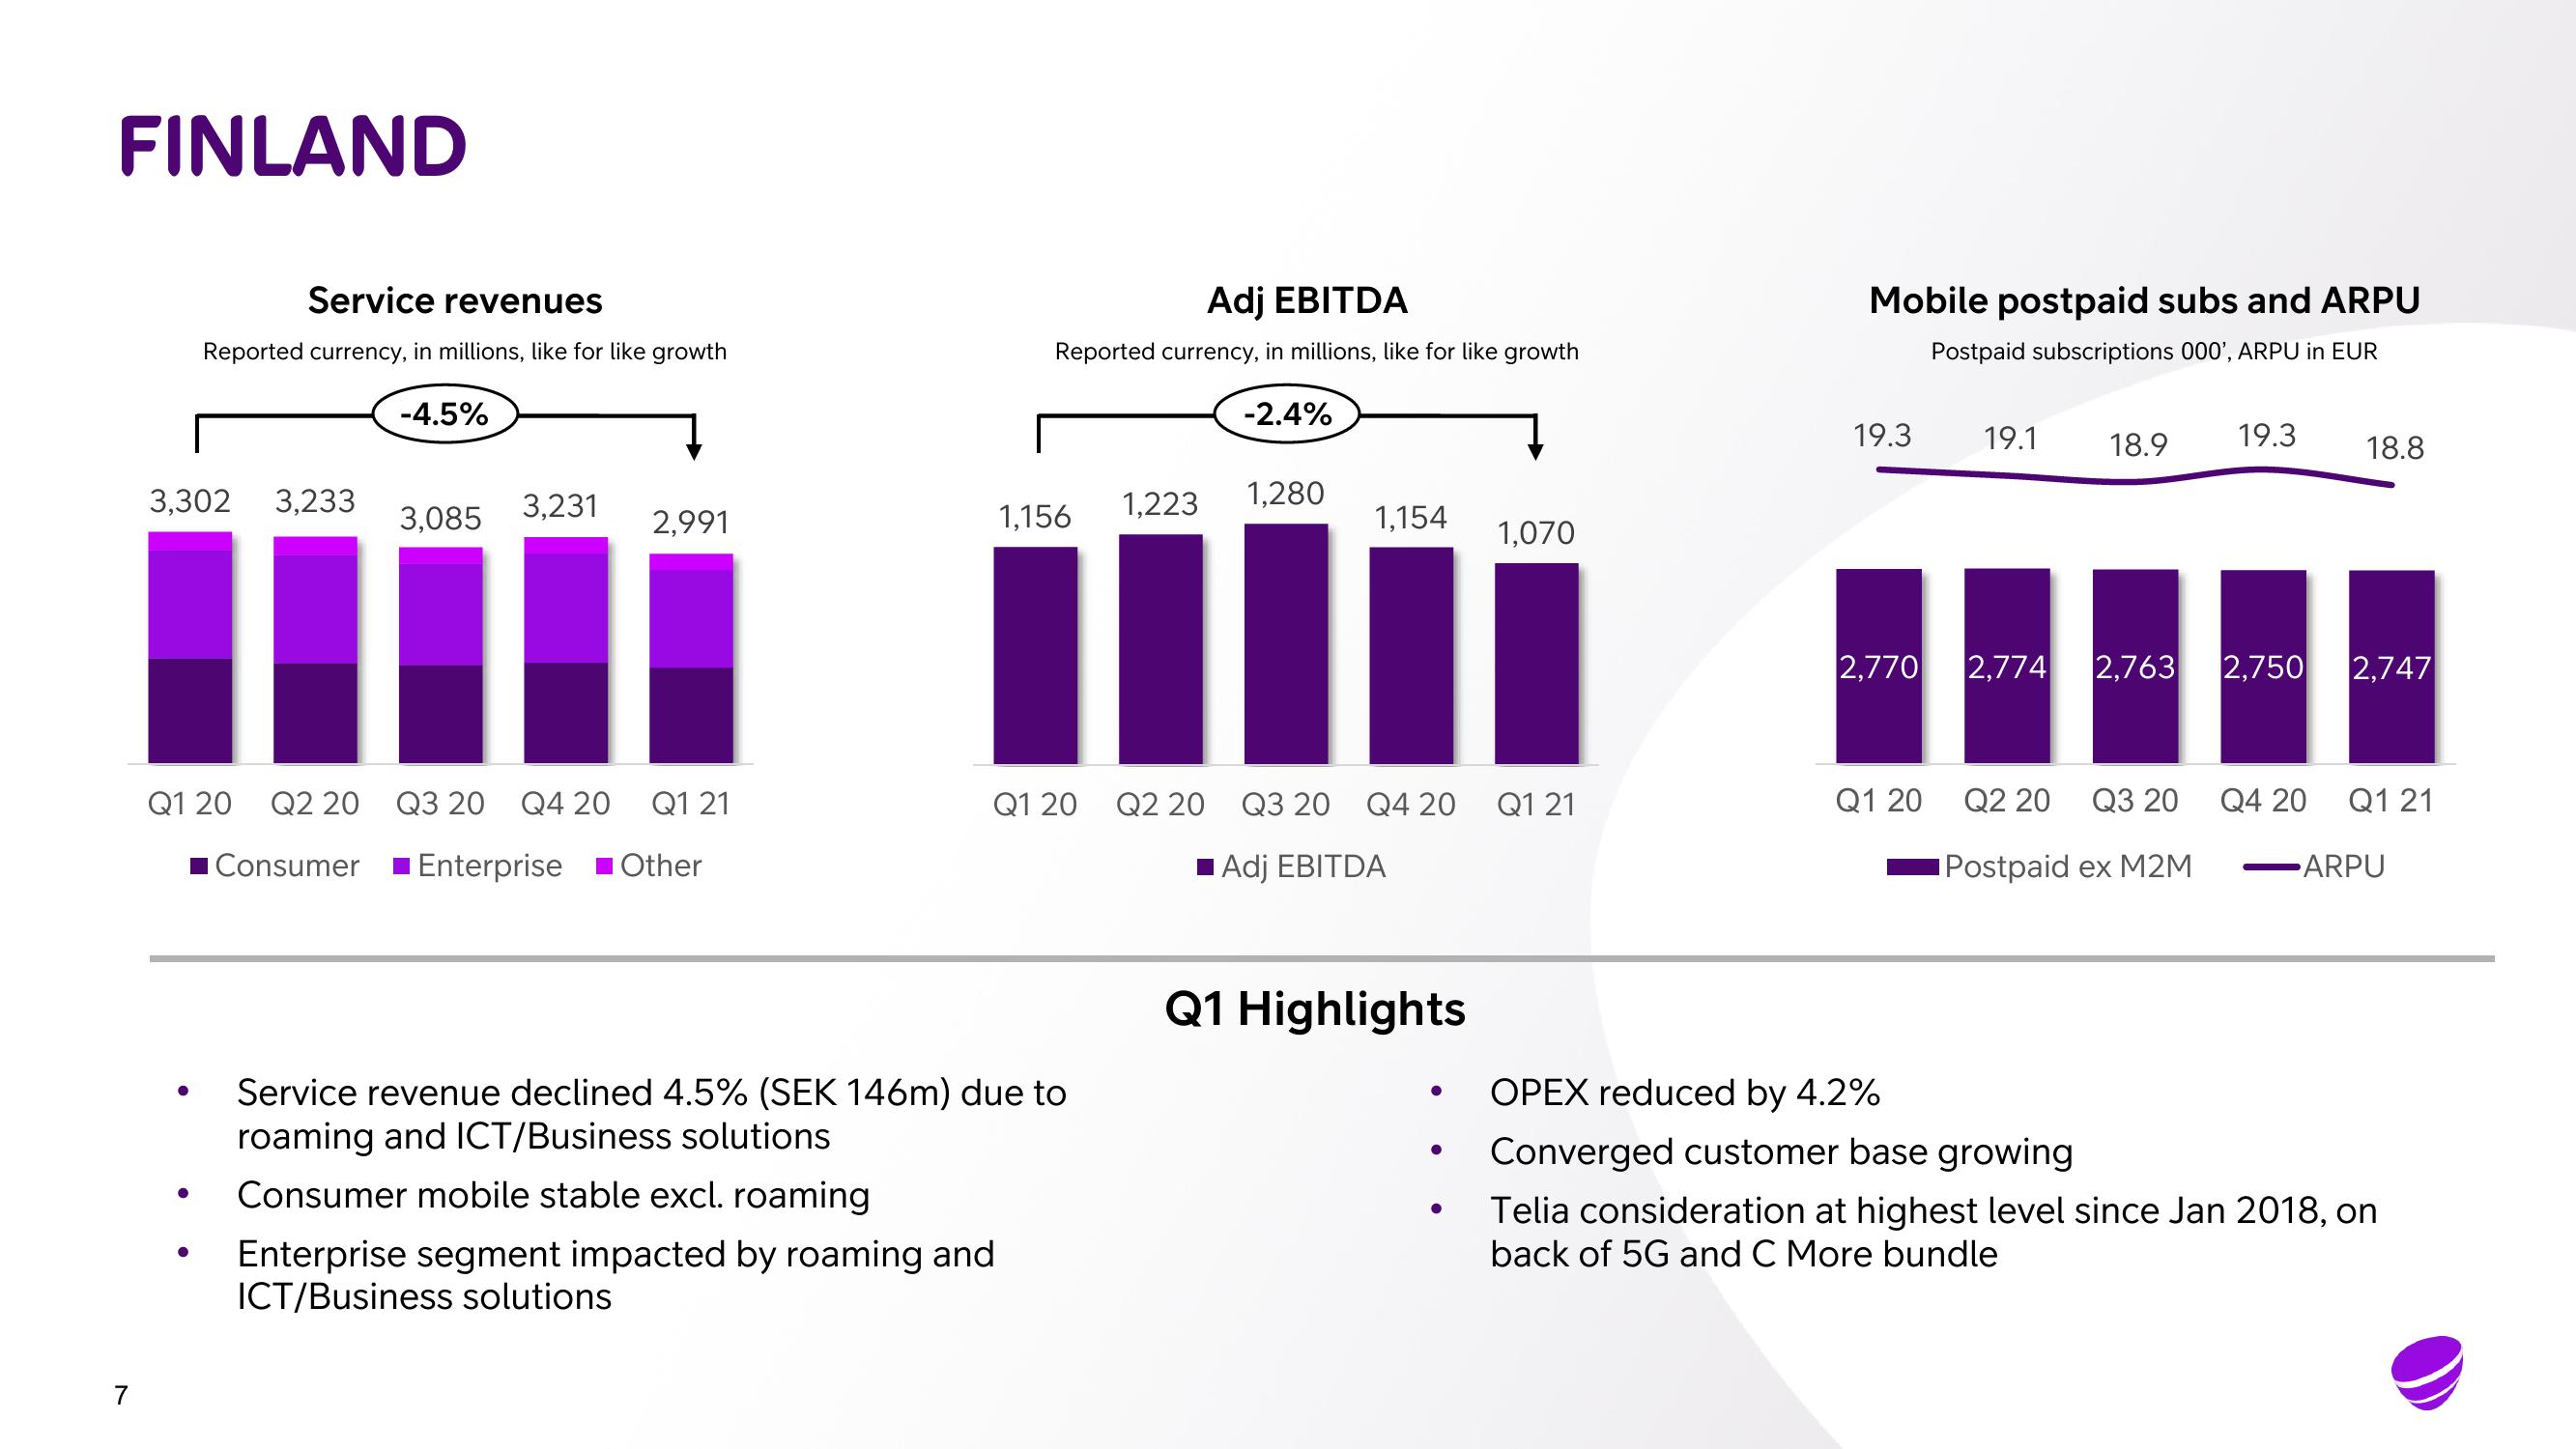
Service revenue declined 4.5% (SEK 146m) due to
roaming and ICT/Business solutions
Consumer mobile stable excl. roaming
Enterprise segment impacted by roaming and
ICT/Business solutions
1,280
1,154
Q1 20 Q2 20 Q3 20 Q4 20 Q1 21
■Adj EBITDA
Q1 Highlights
●
●
1,070
●
Mobile postpaid subs and ARPU
Postpaid subscriptions 000', ARPU in EUR
19.3
19.1
Q1 20
18.9
19.3
2,770 2,774 2,763 2,750 2,747
Q2 20 Q3 20
Postpaid ex M2M
18.8
Q4 20
Q1 21
ARPU
OPEX reduced by 4.2%
Converged customer base growing
Telia consideration at highest level since Jan 2018, on
back of 5G and C More bundleView entire presentation