Investor Presentation
Strong Execution in Q2; Building Track Record
Key Highlights
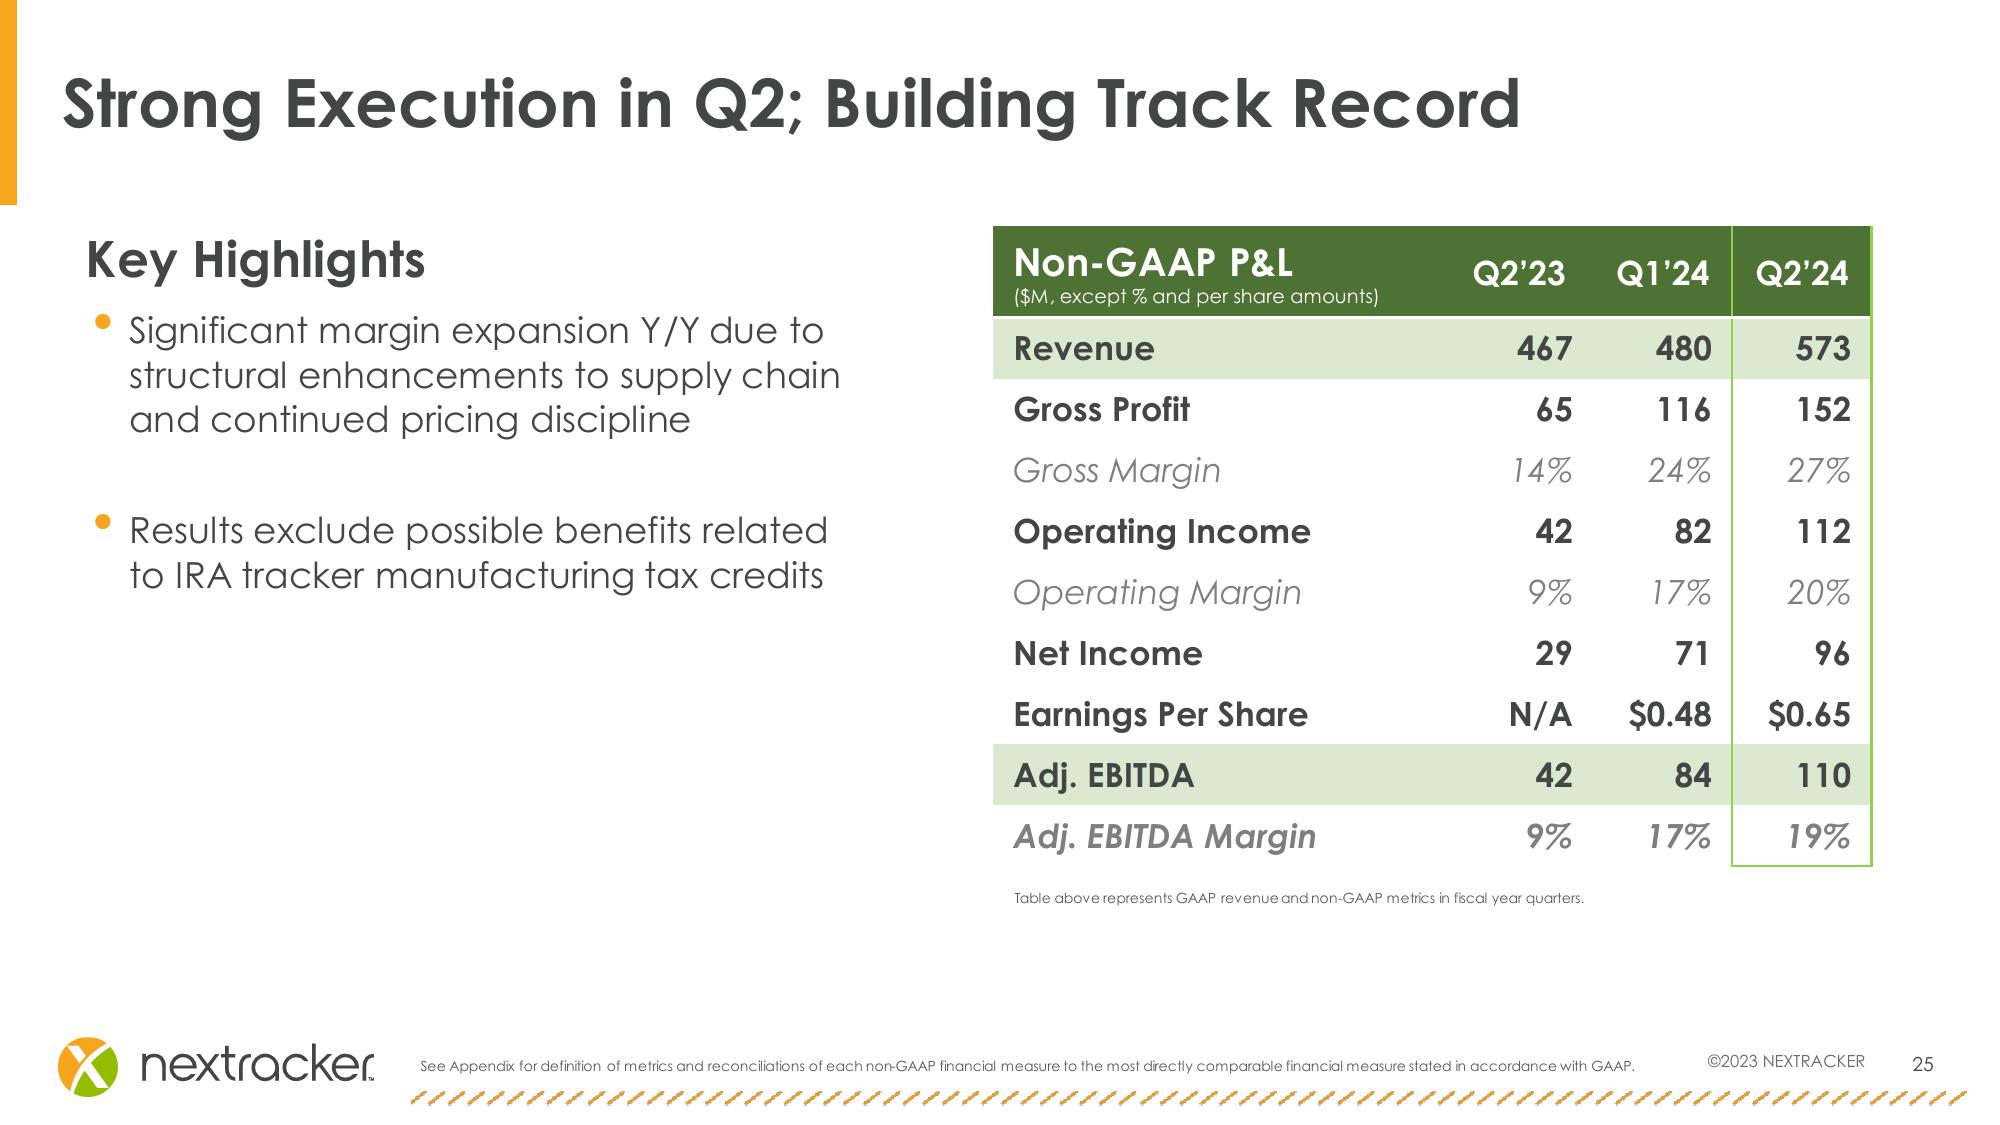
⚫ Significant margin expansion Y/Y due to
structural enhancements to supply chain
and continued pricing discipline
Results exclude possible benefits related
to IRA tracker manufacturing tax credits
Non-GAAP P&L
($M, except % and per share amounts)
Revenue
Gross Profit
Gross Margin
Q2'23 Q1'24 Q2'24
467
480
573
65
116
152
14%
24%
27%
Operating Income
42
82
112
Operating Margin
9%
17%
20%
Net Income
29
71
96
Earnings Per Share
N/A
$0.48
$0.65
Adj. EBITDA
42
84
110
Adj. EBITDA Margin
9%
17%
19%
Table above represents GAAP revenue and non-GAAP metrics in fiscal year quarters.
nextracker.
©2023 NEXTRACKER
See Appendix for definition of metrics and reconciliations of each non-GAAP financial measure to the most directly comparable financial measure stated in accordance with GAAP.
25View entire presentation