Uber Results Presentation Deck
us
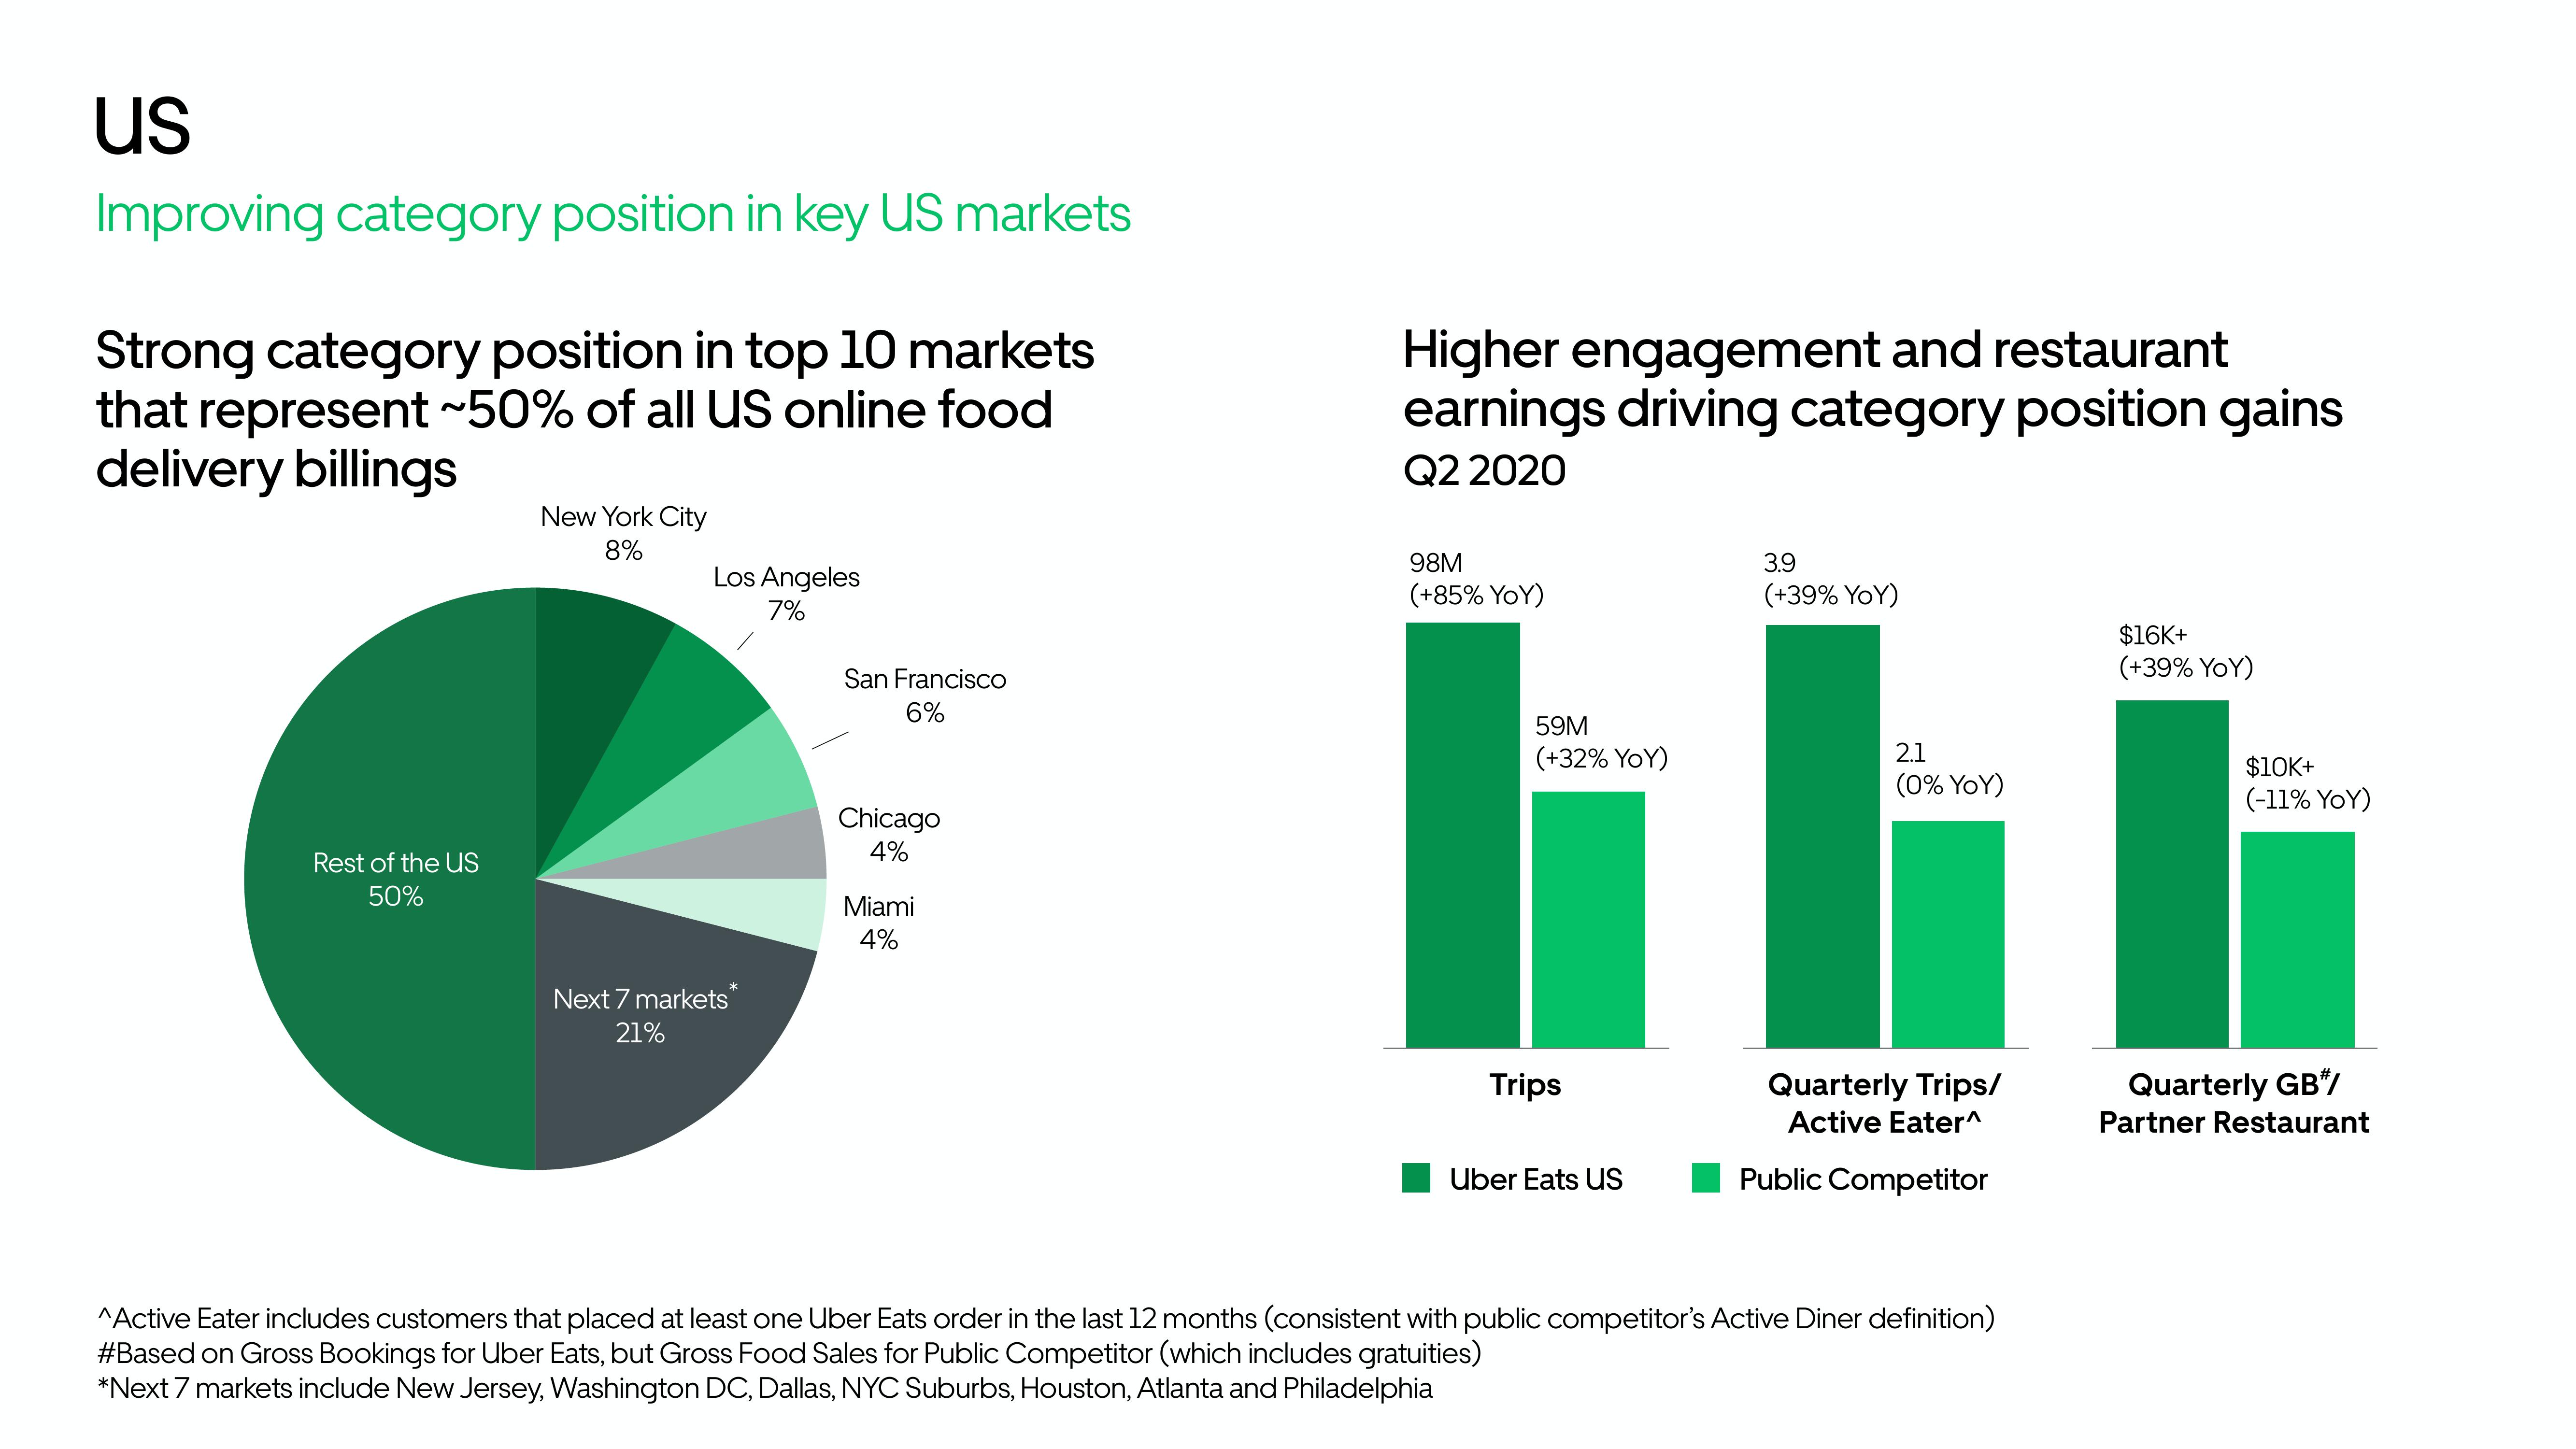
Improving category position in key US markets
Strong category position in top 10 markets
that represent ~50% of all US online food
delivery billings
Rest of the US
50%
New York City
8%
Los Angeles
7%
Next 7 markets
21%
San Francisco
6%
Chicago
4%
Miami
4%
Higher engagement and restaurant
earnings driving category position gains
Q2 2020
98M
(+85% YOY
59M
(+32% YoY)
Trips
Uber Eats Us
3.9
(+39% YoY)
2.1
(0% YoY)
Quarterly Trips/
Active Eater^
Public Competitor
^Active Eater includes customers that placed at least one Uber Eats order in the last 12 months (consistent with public competitor's Active Diner definition)
#Based on Gross Bookings for Uber Eats, but Gross Food Sales for Public Competitor (which includes gratuities)
*Next 7 markets include New Jersey, Washington DC, Dallas, NYC Suburbs, Houston, Atlanta and Philadelphia
$16K+
(+39% YoY)
$10K+
(-11% YoY)
Quarterly GB*/
Partner RestaurantView entire presentation