Kymera Investor Day Presentation Deck
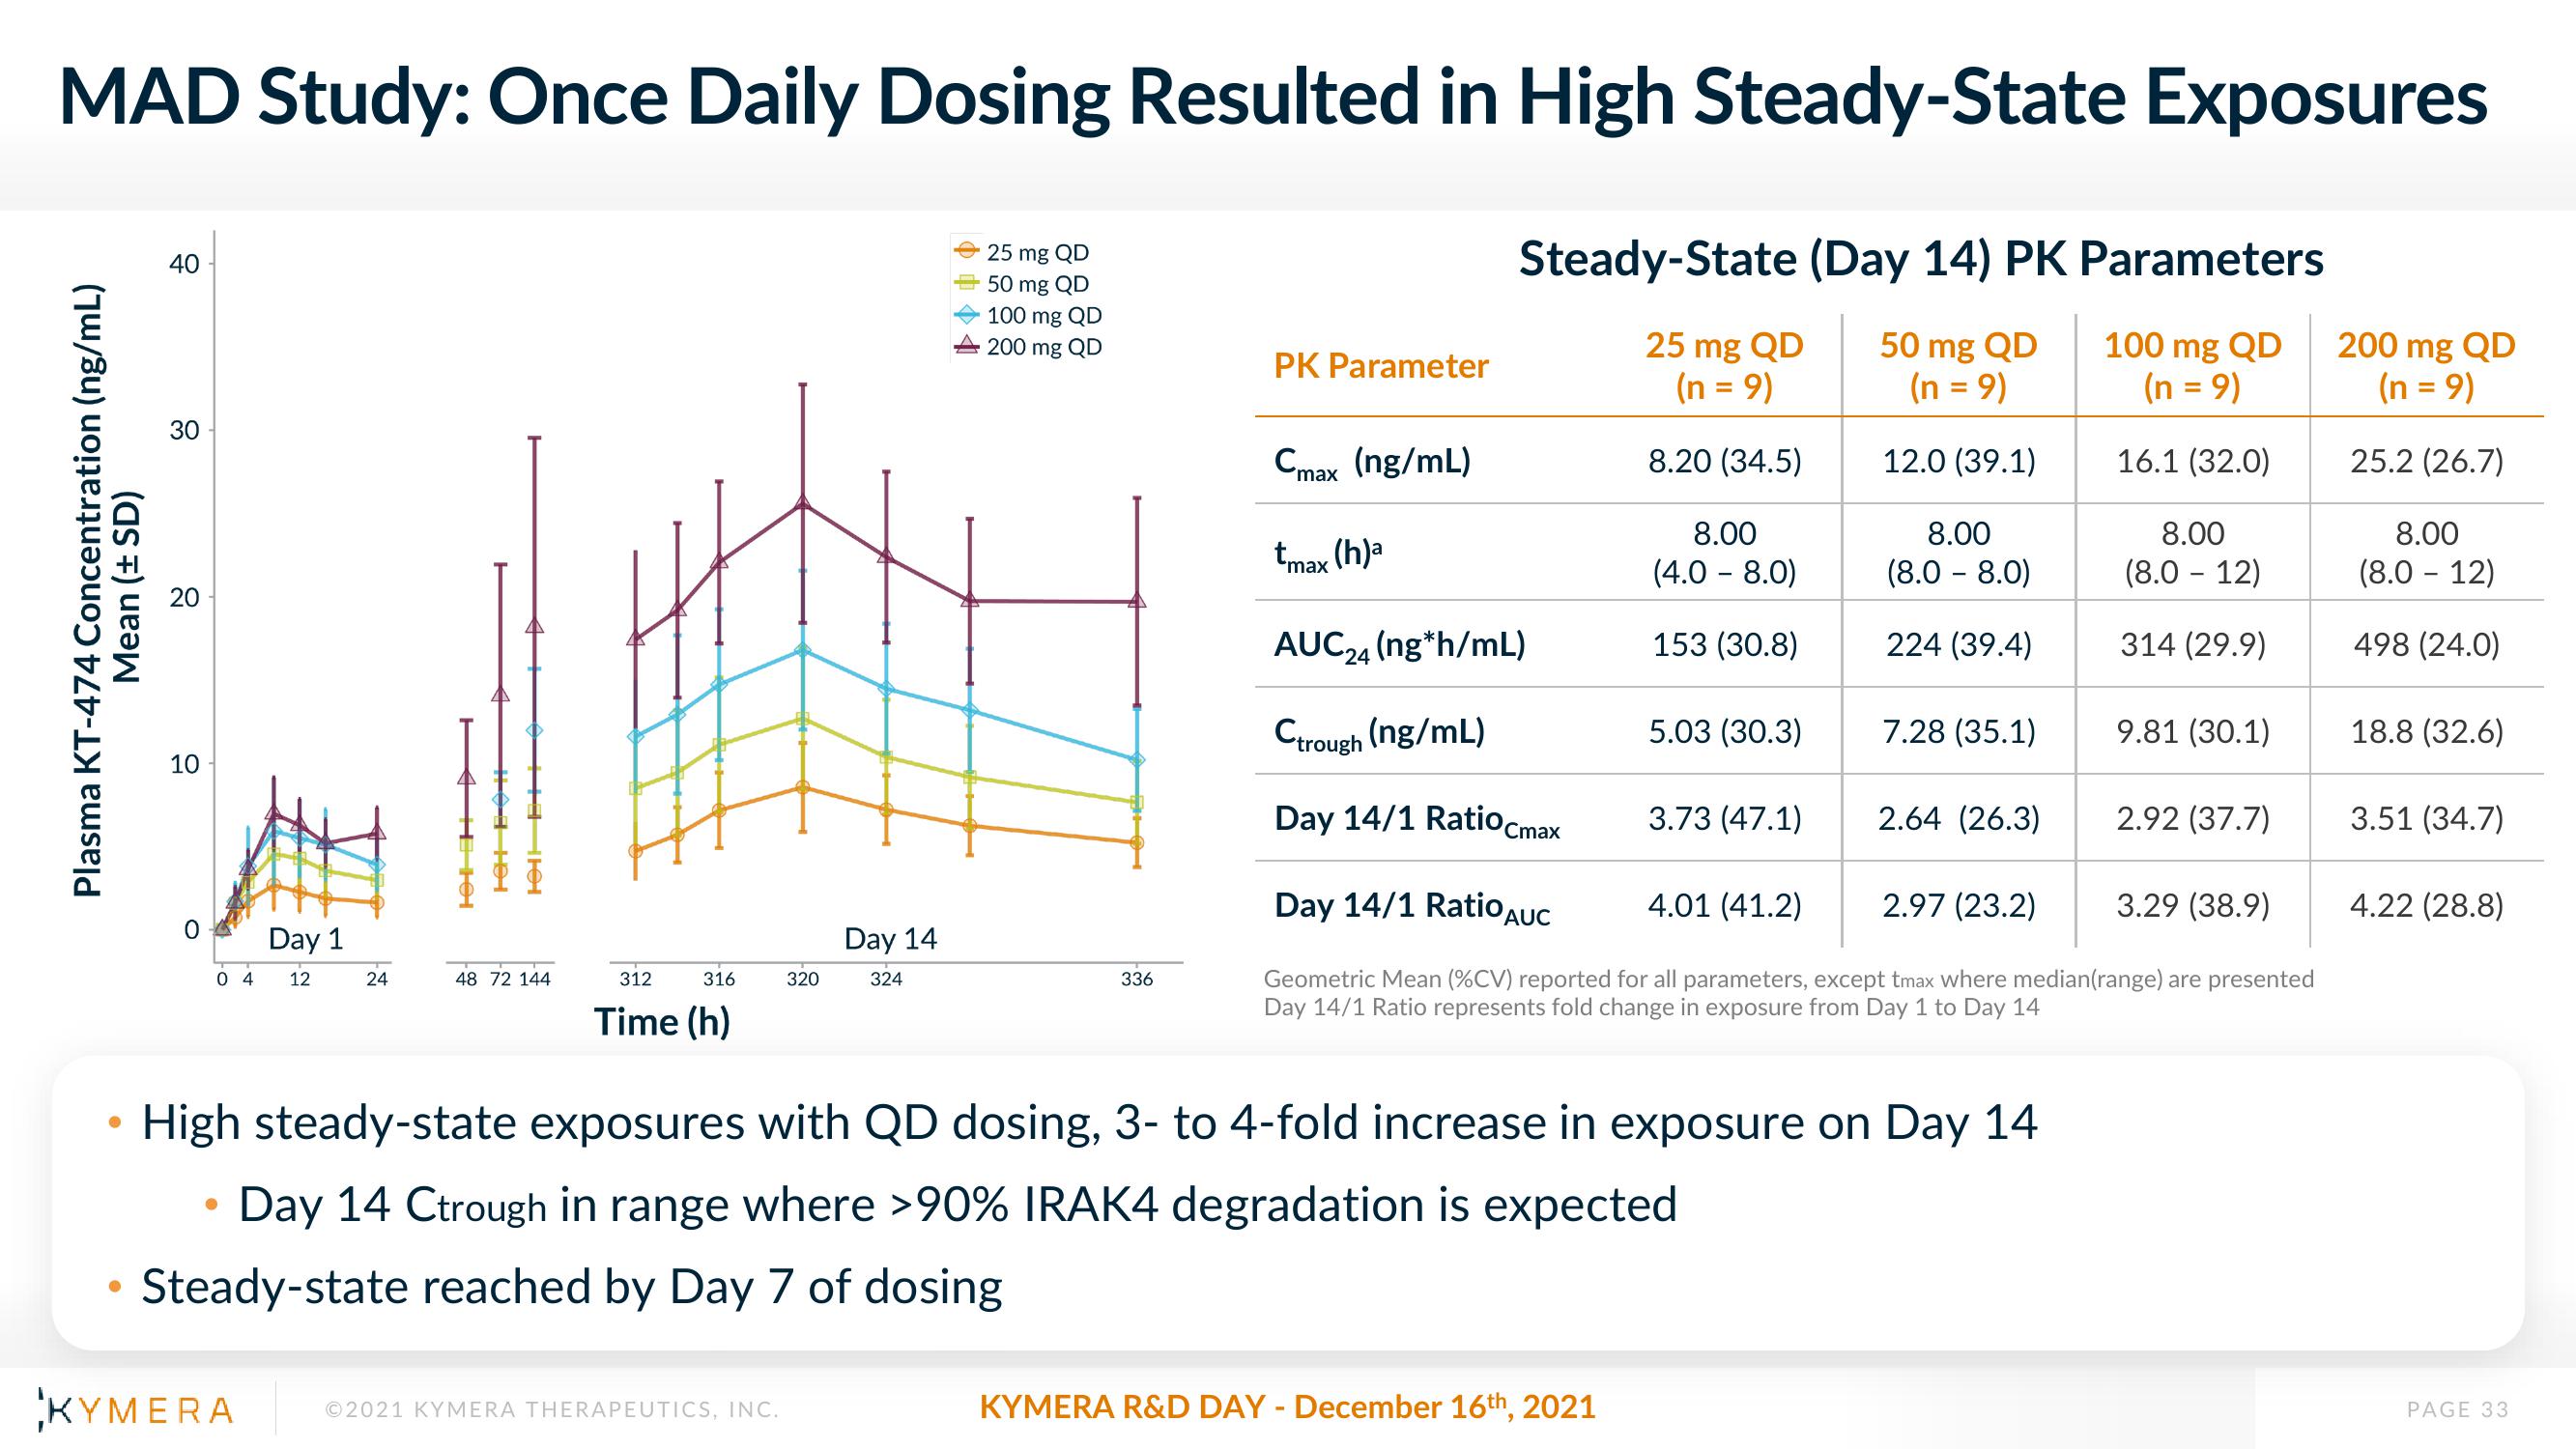
MAD Study: Once Daily Dosing Resulted in High Steady-State Exposures
Plasma KT-474 Concentration (ng/mL)
Mean (± SD)
40
30
20
10
0
04 12
Day 1
●
KYMERA
24
HOA
4 HIGI
HO
T
48 72 144
312
316
Time (h)
320
©2021 KYMERA THERAPEUTICS, INC.
Day 14
324
25 mg QD
50 mg QD
100 mg QD
200 mg QD
336
PK Parameter
Cmax (ng/mL)
Steady-State (Day 14) PK Parameters
25 mg QD
(n = 9)
50 mg QD
(n = 9)
12.0 (39.1)
100 mg QD
(n = 9)
16.1 (32.0)
8.20 (34.5)
tmax
AUC24 (ng*h/mL)
Ctrough (ng/mL)
Day 14/1 Ratio Cmax
(h)a
8.00
(4.0 - 8.0)
153 (30.8)
5.03 (30.3)
KYMERA R&D DAY - December 16th, 2021
3.73 (47.1)
8.00
(8.0 - 8.0)
224 (39.4)
High steady-state exposures with QD dosing, 3- to 4-fold increase in exposure on Day 14
Day 14 Ctrough in range where >90% IRAK4 degradation is expected
Steady-state reached by Day 7 of dosing
7.28 (35.1)
2.64 (26.3)
8.00
(8.0 - 12)
314 (29.9)
9.81 (30.1)
Day 14/1 Ratio AUC
4.01 (41.2)
2.97 (23.2)
Geometric Mean (%CV) reported for all parameters, except tmax where median (range) are presented
Day 14/1 Ratio represents fold change in exposure from Day 1 to Day 14
2.92 (37.7)
3.29 (38.9)
200 mg QD
(n = 9)
25.2 (26.7)
8.00
(8.0 - 12)
498 (24.0)
18.8 (32.6)
3.51 (34.7)
4.22 (28.8)
PAGE 33View entire presentation