Ashtead Group Results Presentation Deck
GROW GENERAL TOOL
CONTINUING TO ADVANCE OUR CLUSTERS THROUGH SUNBELT 3.0
Rental markets
Rental market %
Cluster definition
22
Clusters in FY24
Top 25
57%
>15
19 markets
26-50
19%
Full year results ¦ 30 April 2021
>10
11 markets
US
51-100
16%
>4
19 markets
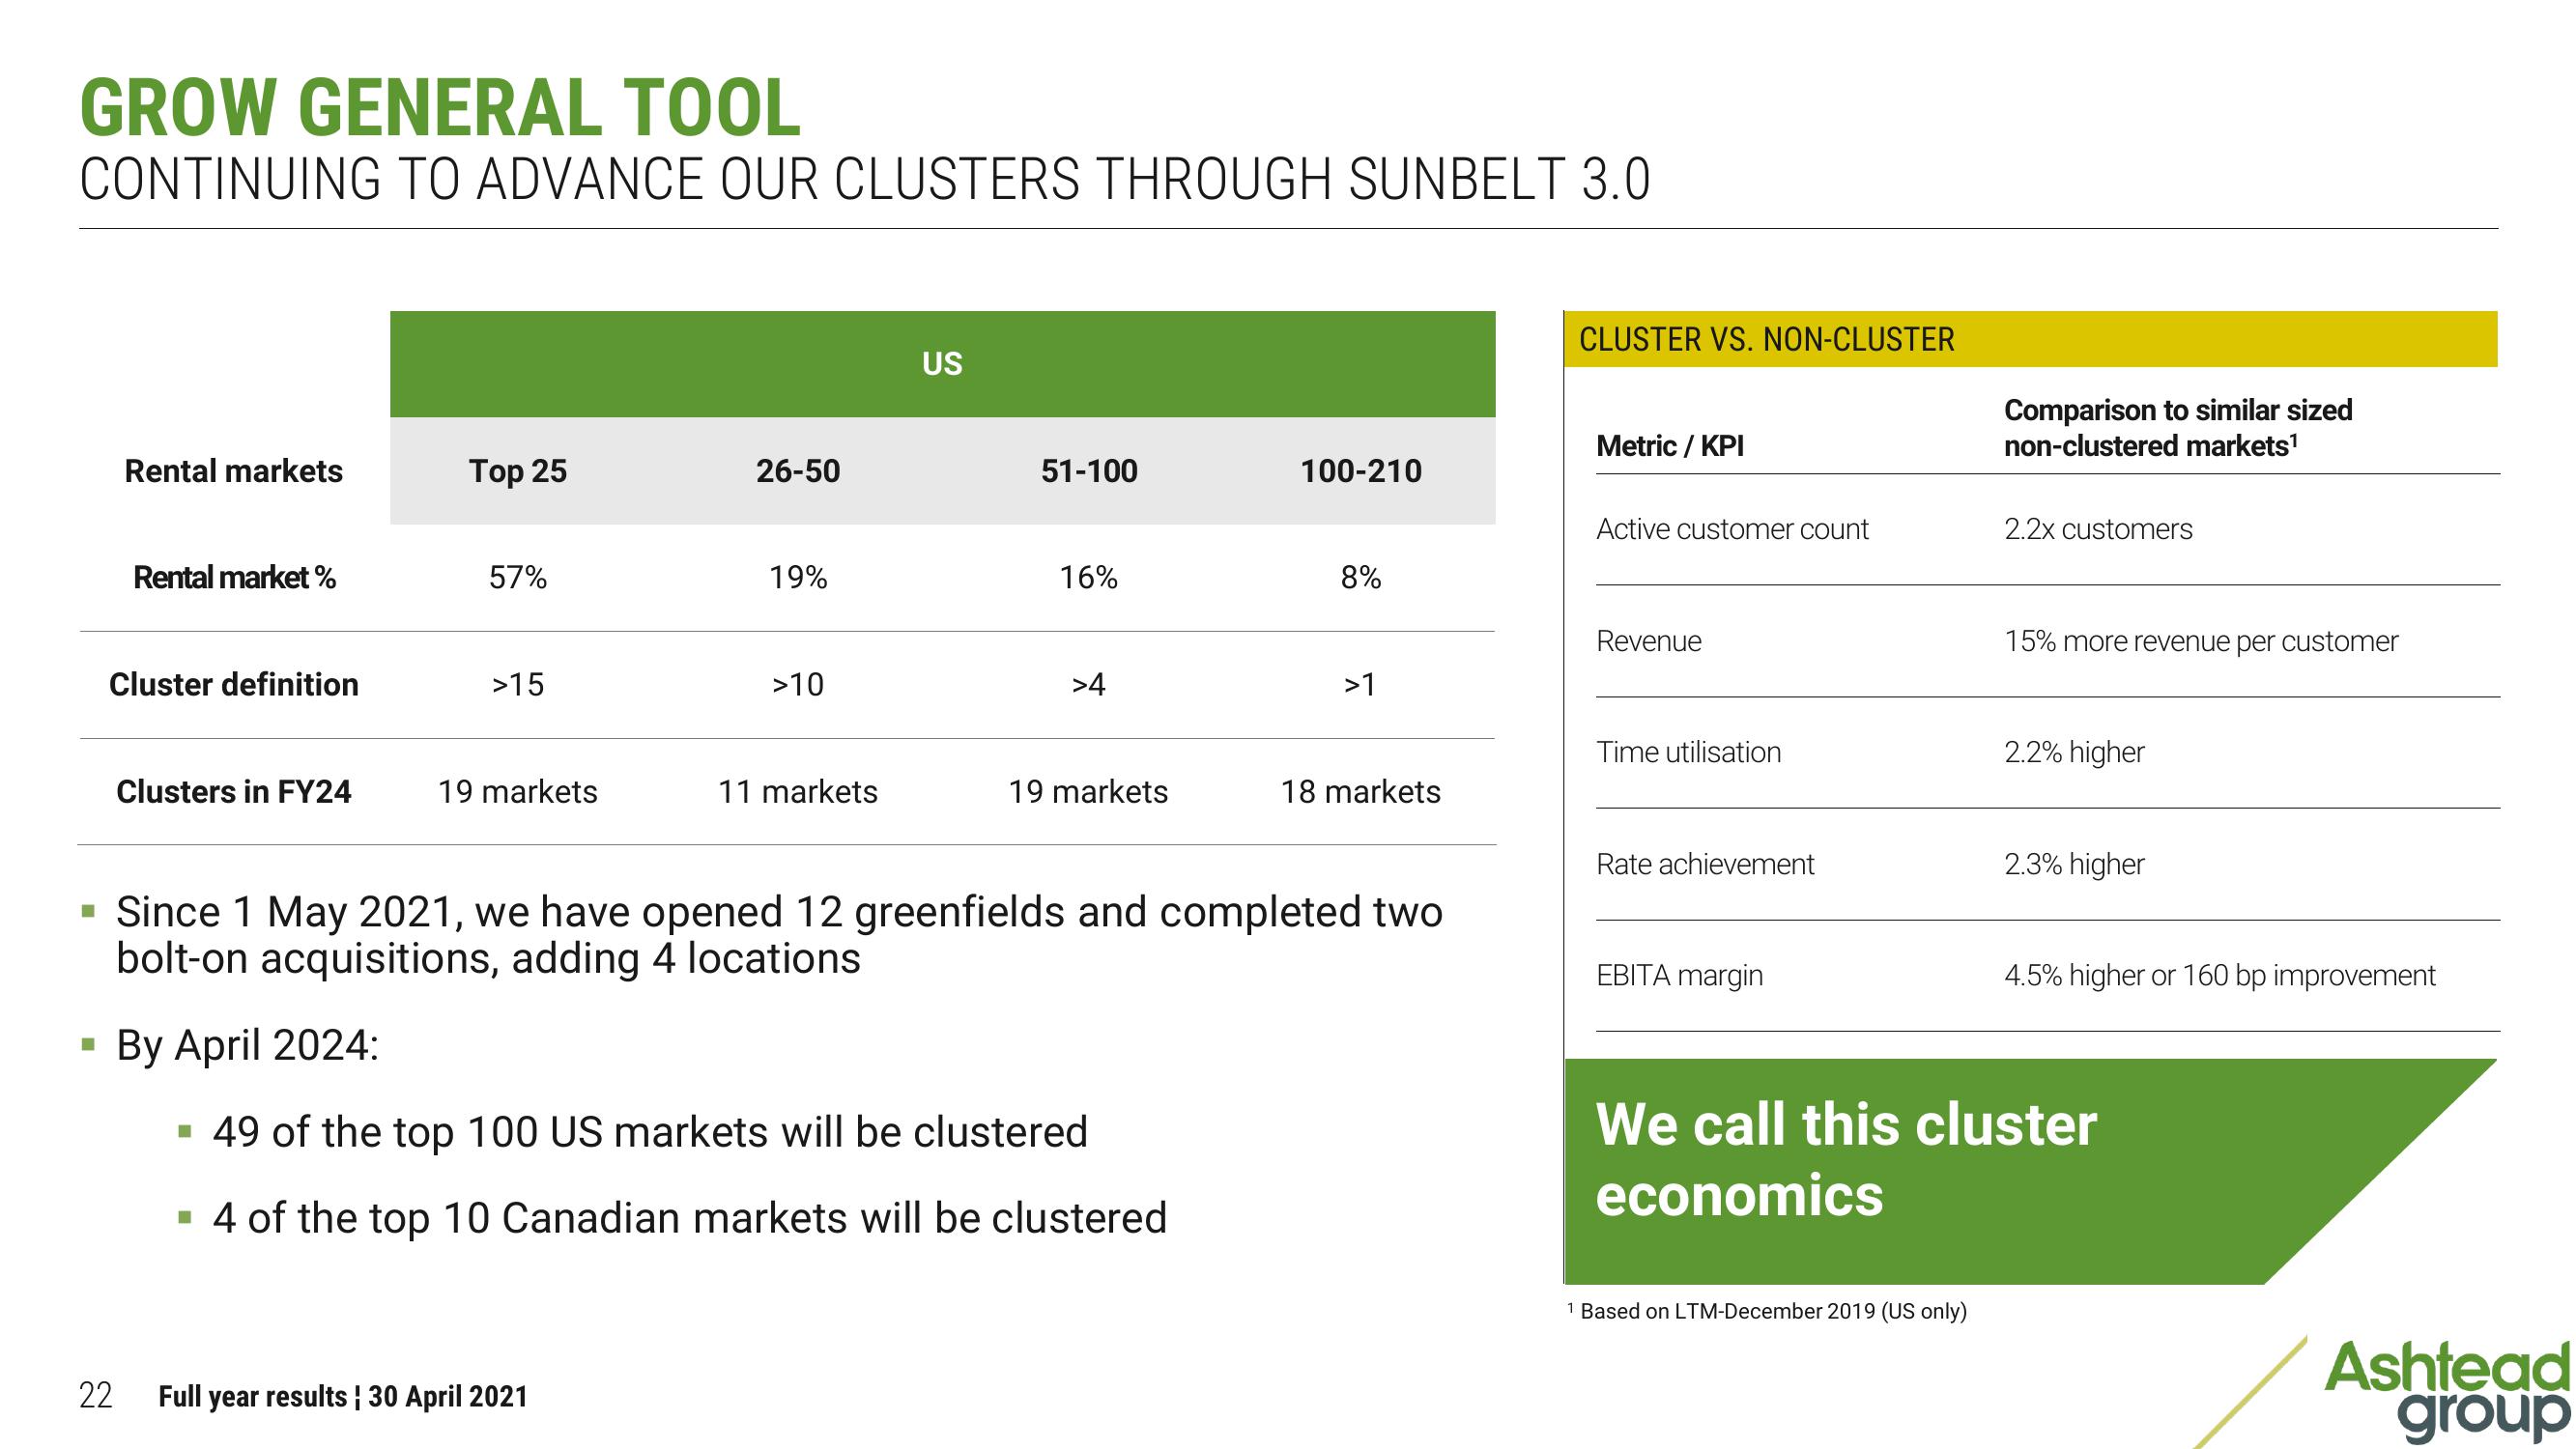
▪ 49 of the top 100 US markets will be clustered
■
4 of the top 10 Canadian markets will be clustered
100-210
8%
Since 1 May 2021, we have opened 12 greenfields and completed two
bolt-on acquisitions, adding 4 locations
▪ By April 2024:
>1
18 markets
CLUSTER VS. NON-CLUSTER
Metric / KPI
Active customer count
Revenue
Time utilisation
Rate achievement
EBITA margin
Comparison to similar sized
non-clustered markets¹
1 Based on LTM-December 2019 (US only)
2.2x customers
15% more revenue per customer
2.2% higher
2.3% higher
4.5% higher or 160 bp improvement
We call this cluster
economics
Ashtead
groupView entire presentation