HashiCorp Investor Presentation Deck
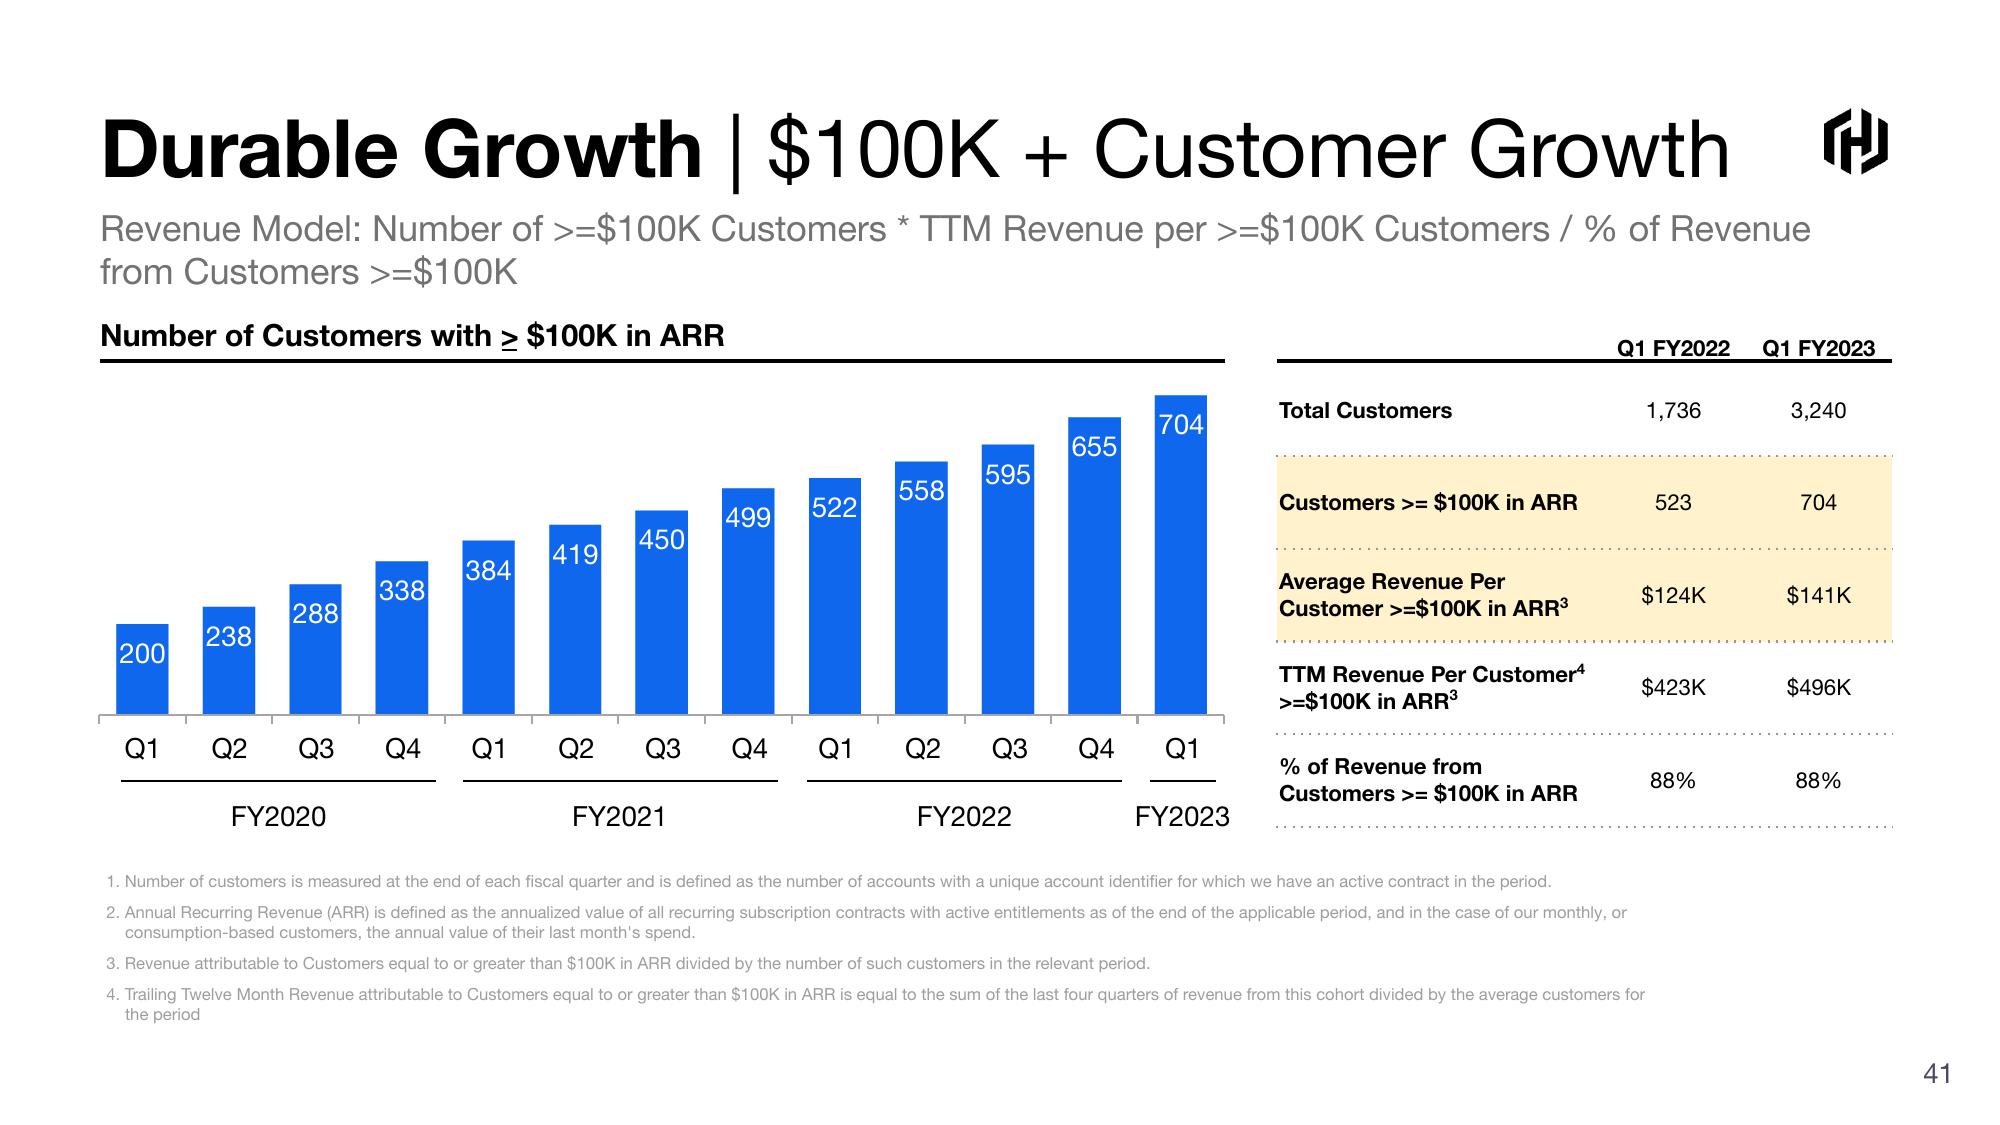
Durable Growth | $100K + Customer Growth
Revenue Model: Number of >=$100K Customers * TTM Revenue per >=$100K Customers/ % of Revenue
from Customers >= $100K
Number of Customers with > $100K in ARR
200
Q1
238
288
338
FY2020
384
Q2 Q3 Q4 Q1
419
450
499
FY2021
522
558
Q2 Q3 Q4 Q1 Q2
595
Q3
FY2022
655
Q4
704
Q1
FY2023
Total Customers
Customers >= $100K in ARR
Average Revenue Per
Customer >=$100K in ARR³
TTM Revenue Per Customer4
>=$100K in ARR³
% of Revenue from
Customers >= $100K in ARR
Q1 FY2022
1,736
523
$124K
$423K
1. Number of customers is measured at the end of each fiscal quarter and is defined as the number of accounts with a unique account identifier for which we have an active contract in the period.
2. Annual Recurring Revenue (ARR) is defined as the annualized value of all recurring subscription contracts with active entitlements as of the end of the applicable period, and in the case of our monthly, or
consumption-based customers, the annual value of their last month's spend.
3. Revenue attributable to Customers equal to or greater than $100K in ARR divided by the number of such customers in the relevant period.
4. Trailing Twelve Month Revenue attributable to Customers equal to or greater than $100K in ARR is equal to the sum of the last four quarters of revenue from this cohort divided by the average customers for
the period
88%
Q1 FY2023
3,240
704
$141K
$496K
88%
41View entire presentation