Crocs Investor Presentation Deck
NON-GAAP RECONCILIATION (cont'd)
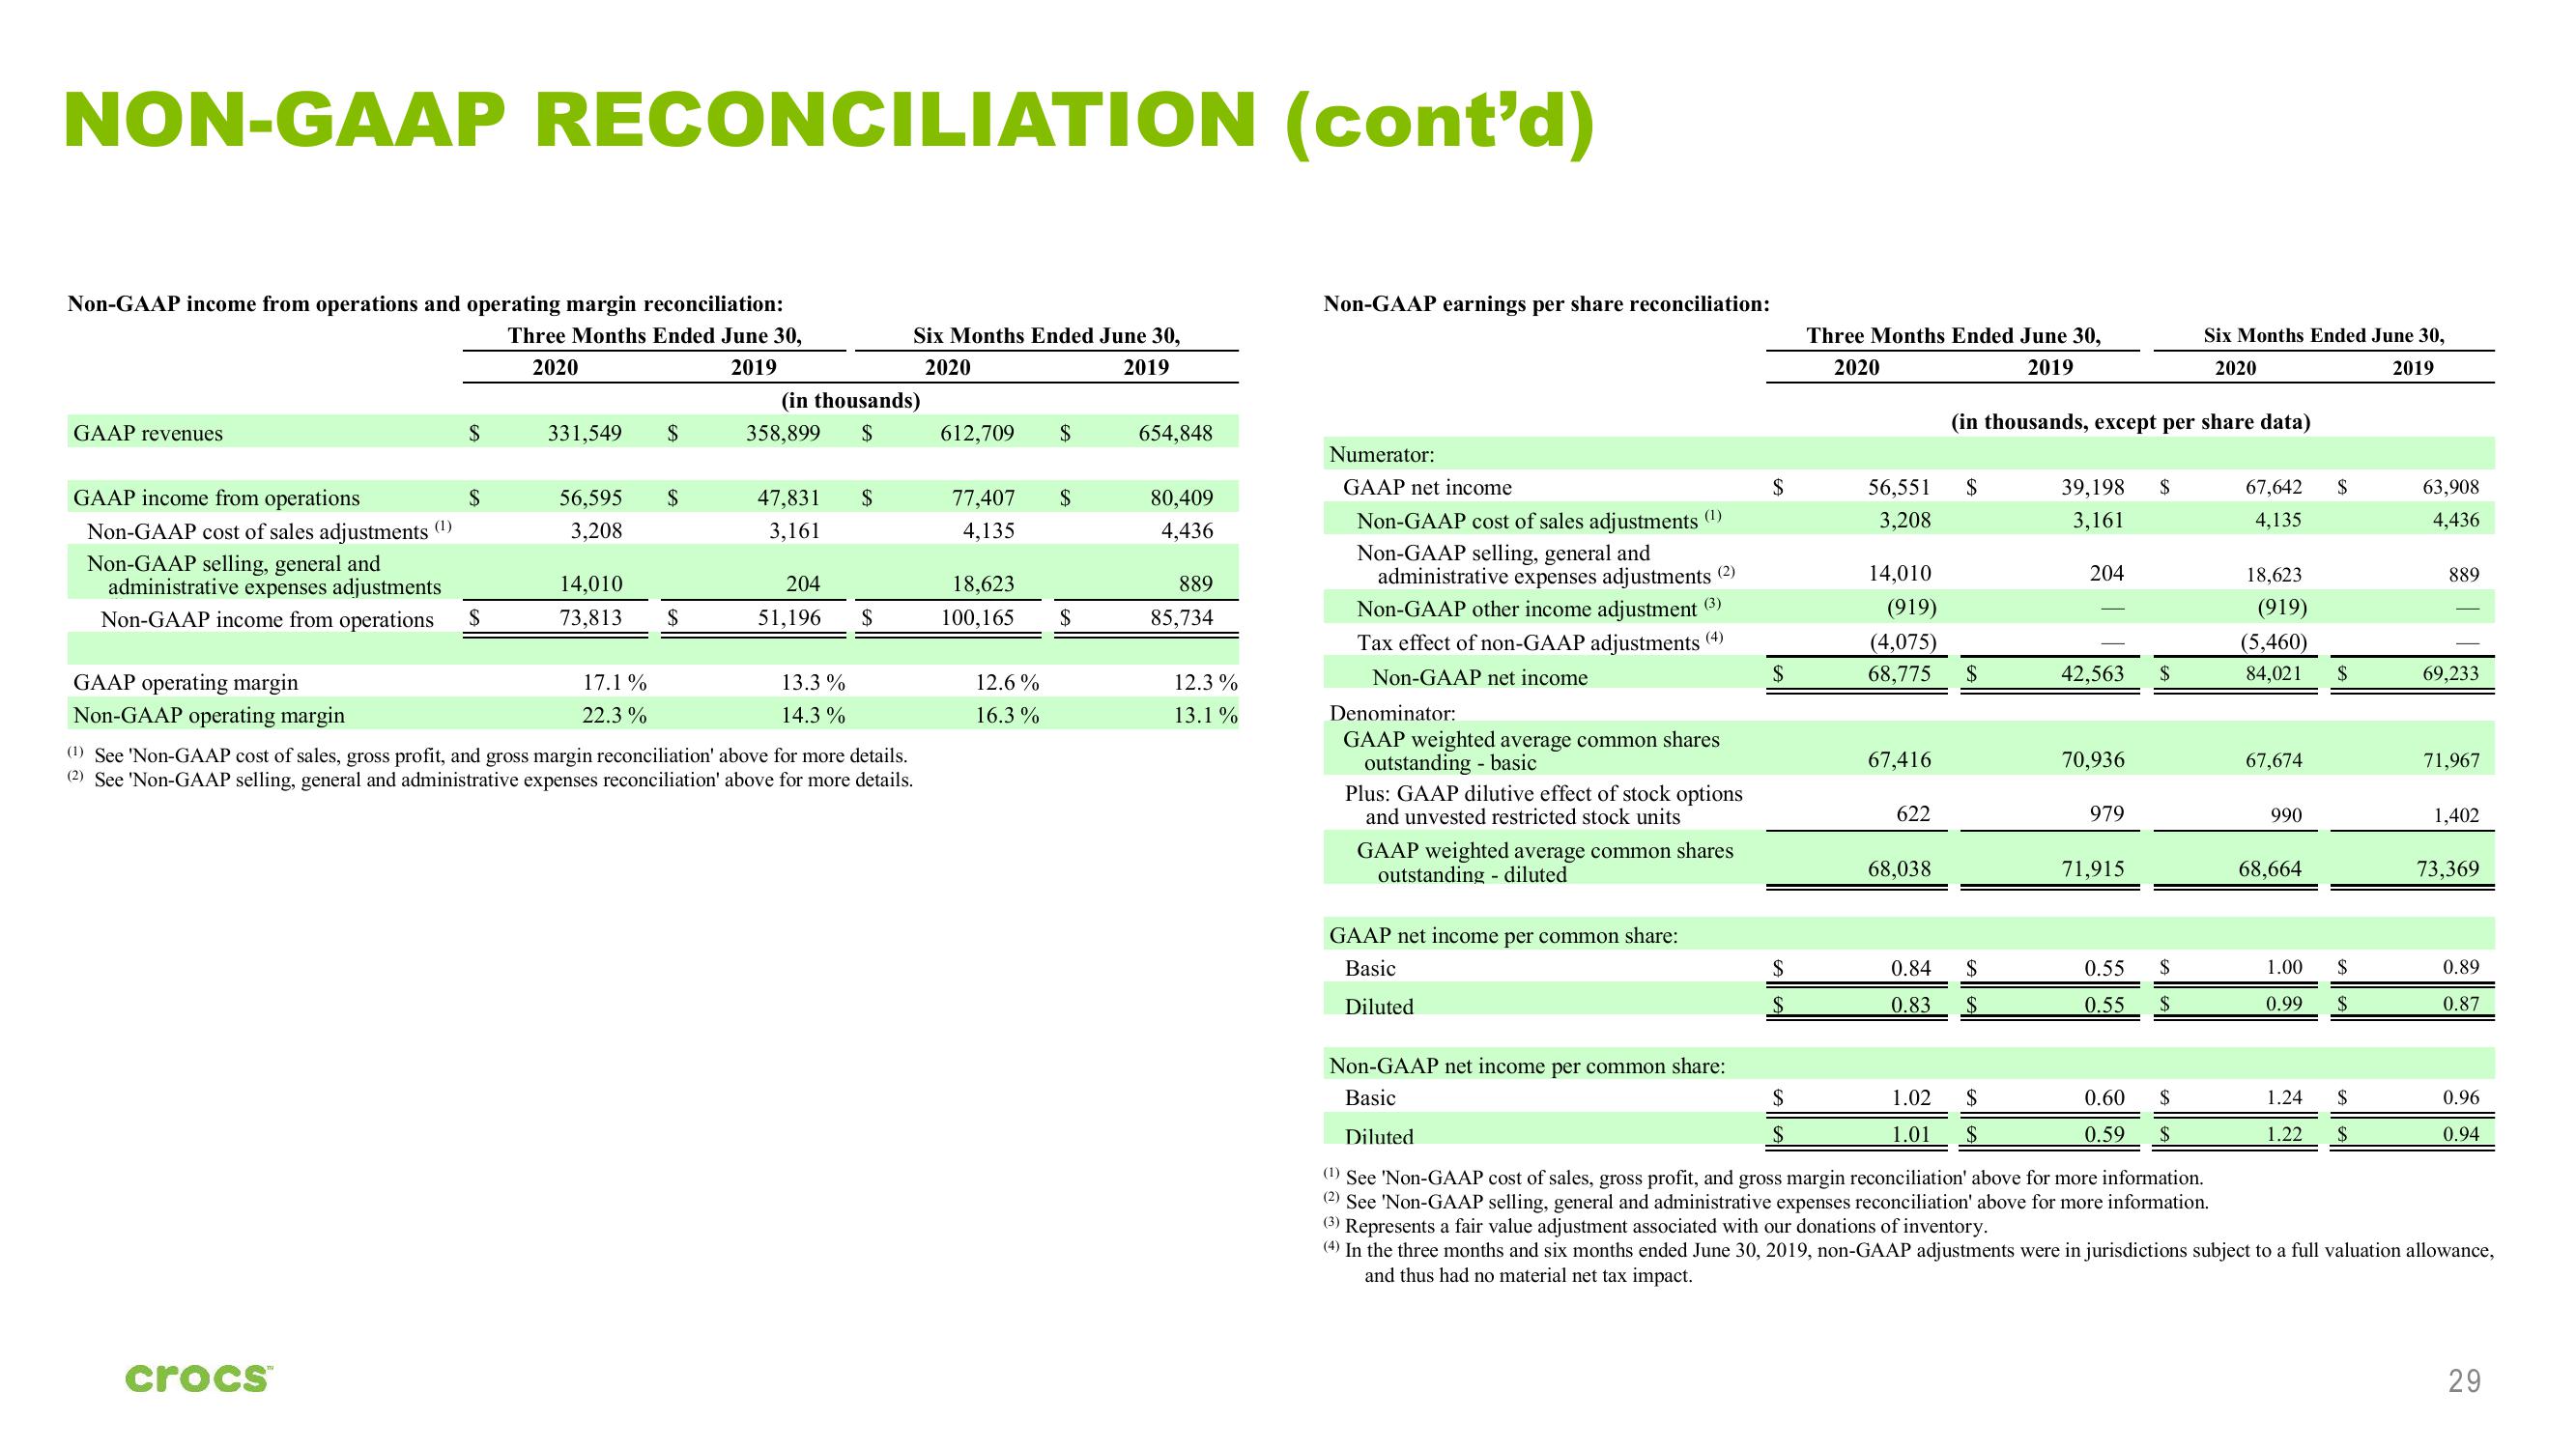
Non-GAAP income from operations and operating margin reconciliation:
Three Months Ended June 30,
2020
2019
GAAP revenues
$
$
GAAP income from operations
Non-GAAP cost of sales adjustments (¹)
Non-GAAP selling, general and
administrative expenses adjustments
Non-GAAP income from operations
crocs™
$
331,549 $
56,595
3,208
14,010
73,813
$
17.1%
22.3%
$
(in thousands)
358,899 $
47,831
3,161
204
51,196
$
GAAP operating margin
Non-GAAP operating margin
(1) See 'Non-GAAP cost of sales, gross profit, and gross margin reconciliation' above for more details.
(2) See 'Non-GAAP selling, general and administrative expenses reconciliation' above for more details.
13.3%
14.3%
Six Months Ended June 30,
2020
2019
$
612,709 $
77,407
4,135
18,623
100,165
12.6%
16.3%
$
$
654,848
80,409
4,436
889
85,734
12.3%
13.1%
Non-GAAP earnings per share reconciliation:
Numerator:
GAAP net income
Non-GAAP cost of sales adjustments (¹)
Non-GAAP selling, general and
administrative expenses adjustments (2)
Non-GAAP other income adjustment (3)
Tax effect of non-GAAP adjustments (4)
Non-GAAP net income
Denominator:
GAAP weighted average common shares
outstanding - basic
Plus: GAAP dilutive effect of stock options
and unvested restricted stock units
GAAP weighted average common shares
outstanding diluted
GAAP net income per common share:
Basic
Diluted
Non-GAAP net income per common share:
Basic
Diluted
$
$
$
$
$
Three Months Ended June 30,
2020
2019
56,551
3,208
14,010
(919)
(4,075)
68,775
67,416
622
68,038
0.84
0.83
1.02
1.01
(in thousands, except per share data)
$
$
$
$
$
39,198 $
3,161
204
42,563
70,936
979
71,915
0.55
0.55
$
$
$
Six Months Ended June 30,
2020
2019
0.60 $
0.59 $
(¹) See 'Non-GAAP cost of sales, gross profit, and gross margin reconciliation' above for more information.
(2) See 'Non-GAAP selling, general and administrative expenses reconciliation' above for more information.
67,642
4,135
18,623
(919)
(5,460)
84,021
67,674
990
68,664
1.00
0.99
$
$
$
$
1.24 $
1.22
$
63,908
4,436
889
69,233
71,967
1,402
73,369
0.89
0.87
0.96
0.94
(3) Represents a fair value adjustment associated with our donations of inventory.
(4) In the three months and six months ended June 30, 2019, non-GAAP adjustments were in jurisdictions subject to a full valuation allowance,
and thus had no material net tax impact.
29View entire presentation