Evolv SPAC Presentation Deck
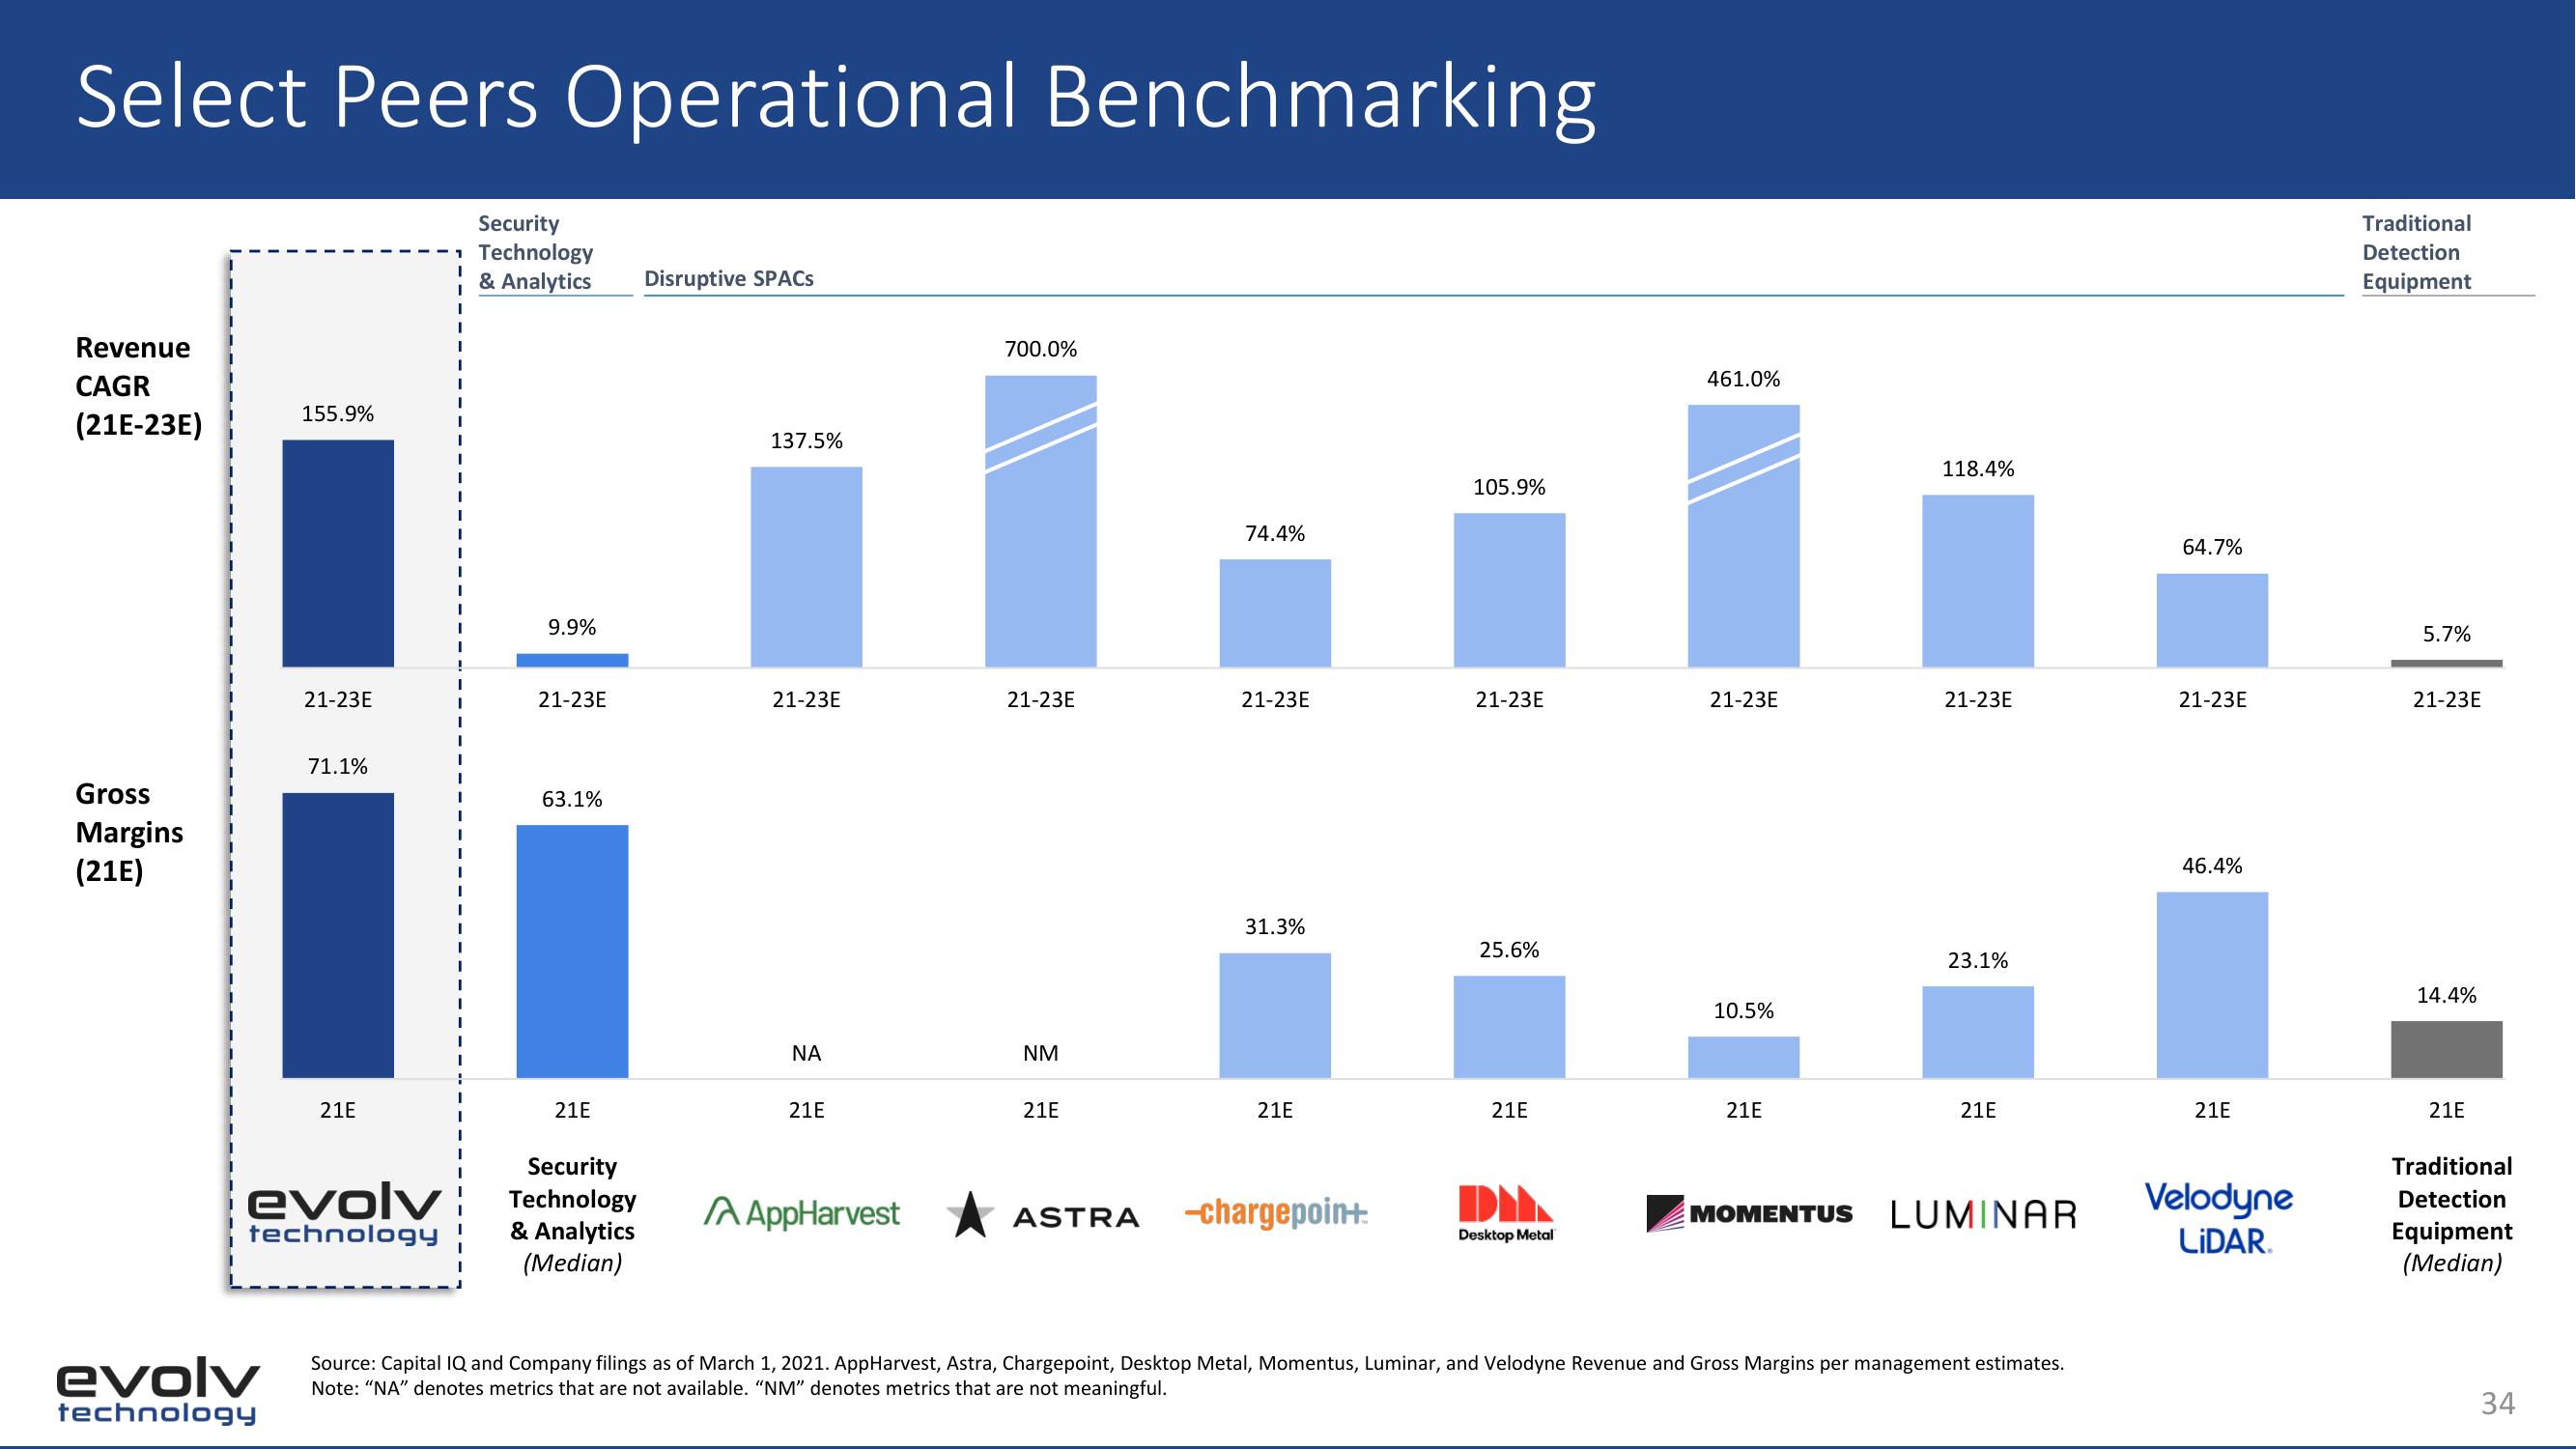
Select Peers Operational Benchmarking
Revenue
CAGR
(21E-23E)
Gross
Margins
(21E)
155.9%
evolv
technology
21-23E
71.1%
21E
evolv
technology
I
I
I
I
T
I
Security
Technology
& Analytics
9.9%
21-23E
63.1%
21E
Security
Technology
& Analytics
(Median)
Disruptive SPACS
137.5%
21-23E
ΝΑ
21E
A AppHarvest
700.0%
21-23E
NM
21E
ASTRA
74.4%
21-23E
31.3%
21E
-chargepoint.
105.9%
21-23E
25.6%
21E
DI
Desktop Metal
461.0%
21-23E
10.5%
21E
118.4%
21-23E
23.1%
21E
MOMENTUS LUMINAR
Source: Capital IQ and Company filings as of March 1, 2021. AppHarvest, Astra, Chargepoint, Desktop Metal, Momentus, Luminar, and Velodyne Revenue and Gross Margins per management estimates.
Note: "NA" denotes metrics that are not available. "NM" denotes metrics that are not meaningful.
64.7%
21-23E
46.4%
21E
Velodyne
LIDAR.
Traditional
Detection
Equipment
5.7%
21-23E
14.4%
21E
Traditional
Detection
Equipment
(Median)
34View entire presentation