Disney Results Presentation Deck
Domestic Parks &
Experiences
Int'l Parks &
Experiences
Consumer Products
Domestic Parks &
Experiences
Int'l Parks &
Experiences
Consumer Products
$4.9
$1.4
Q2 Parks, Experiences & Products Results
(In Billions)
$0.6
Q2'22
Revenues
($0.3)
Q2'22
$1.2
$0.6
$5.6
Operating Income
$1.5
Note: Total may not equal the sum of the column due to rounding
©Disney
$1.2 $1.0
Q2'23
$0.2
+1.1 / +17%
Q2'23
+$0.4 / +23%
$0.5
Domestic Parks & Experiences
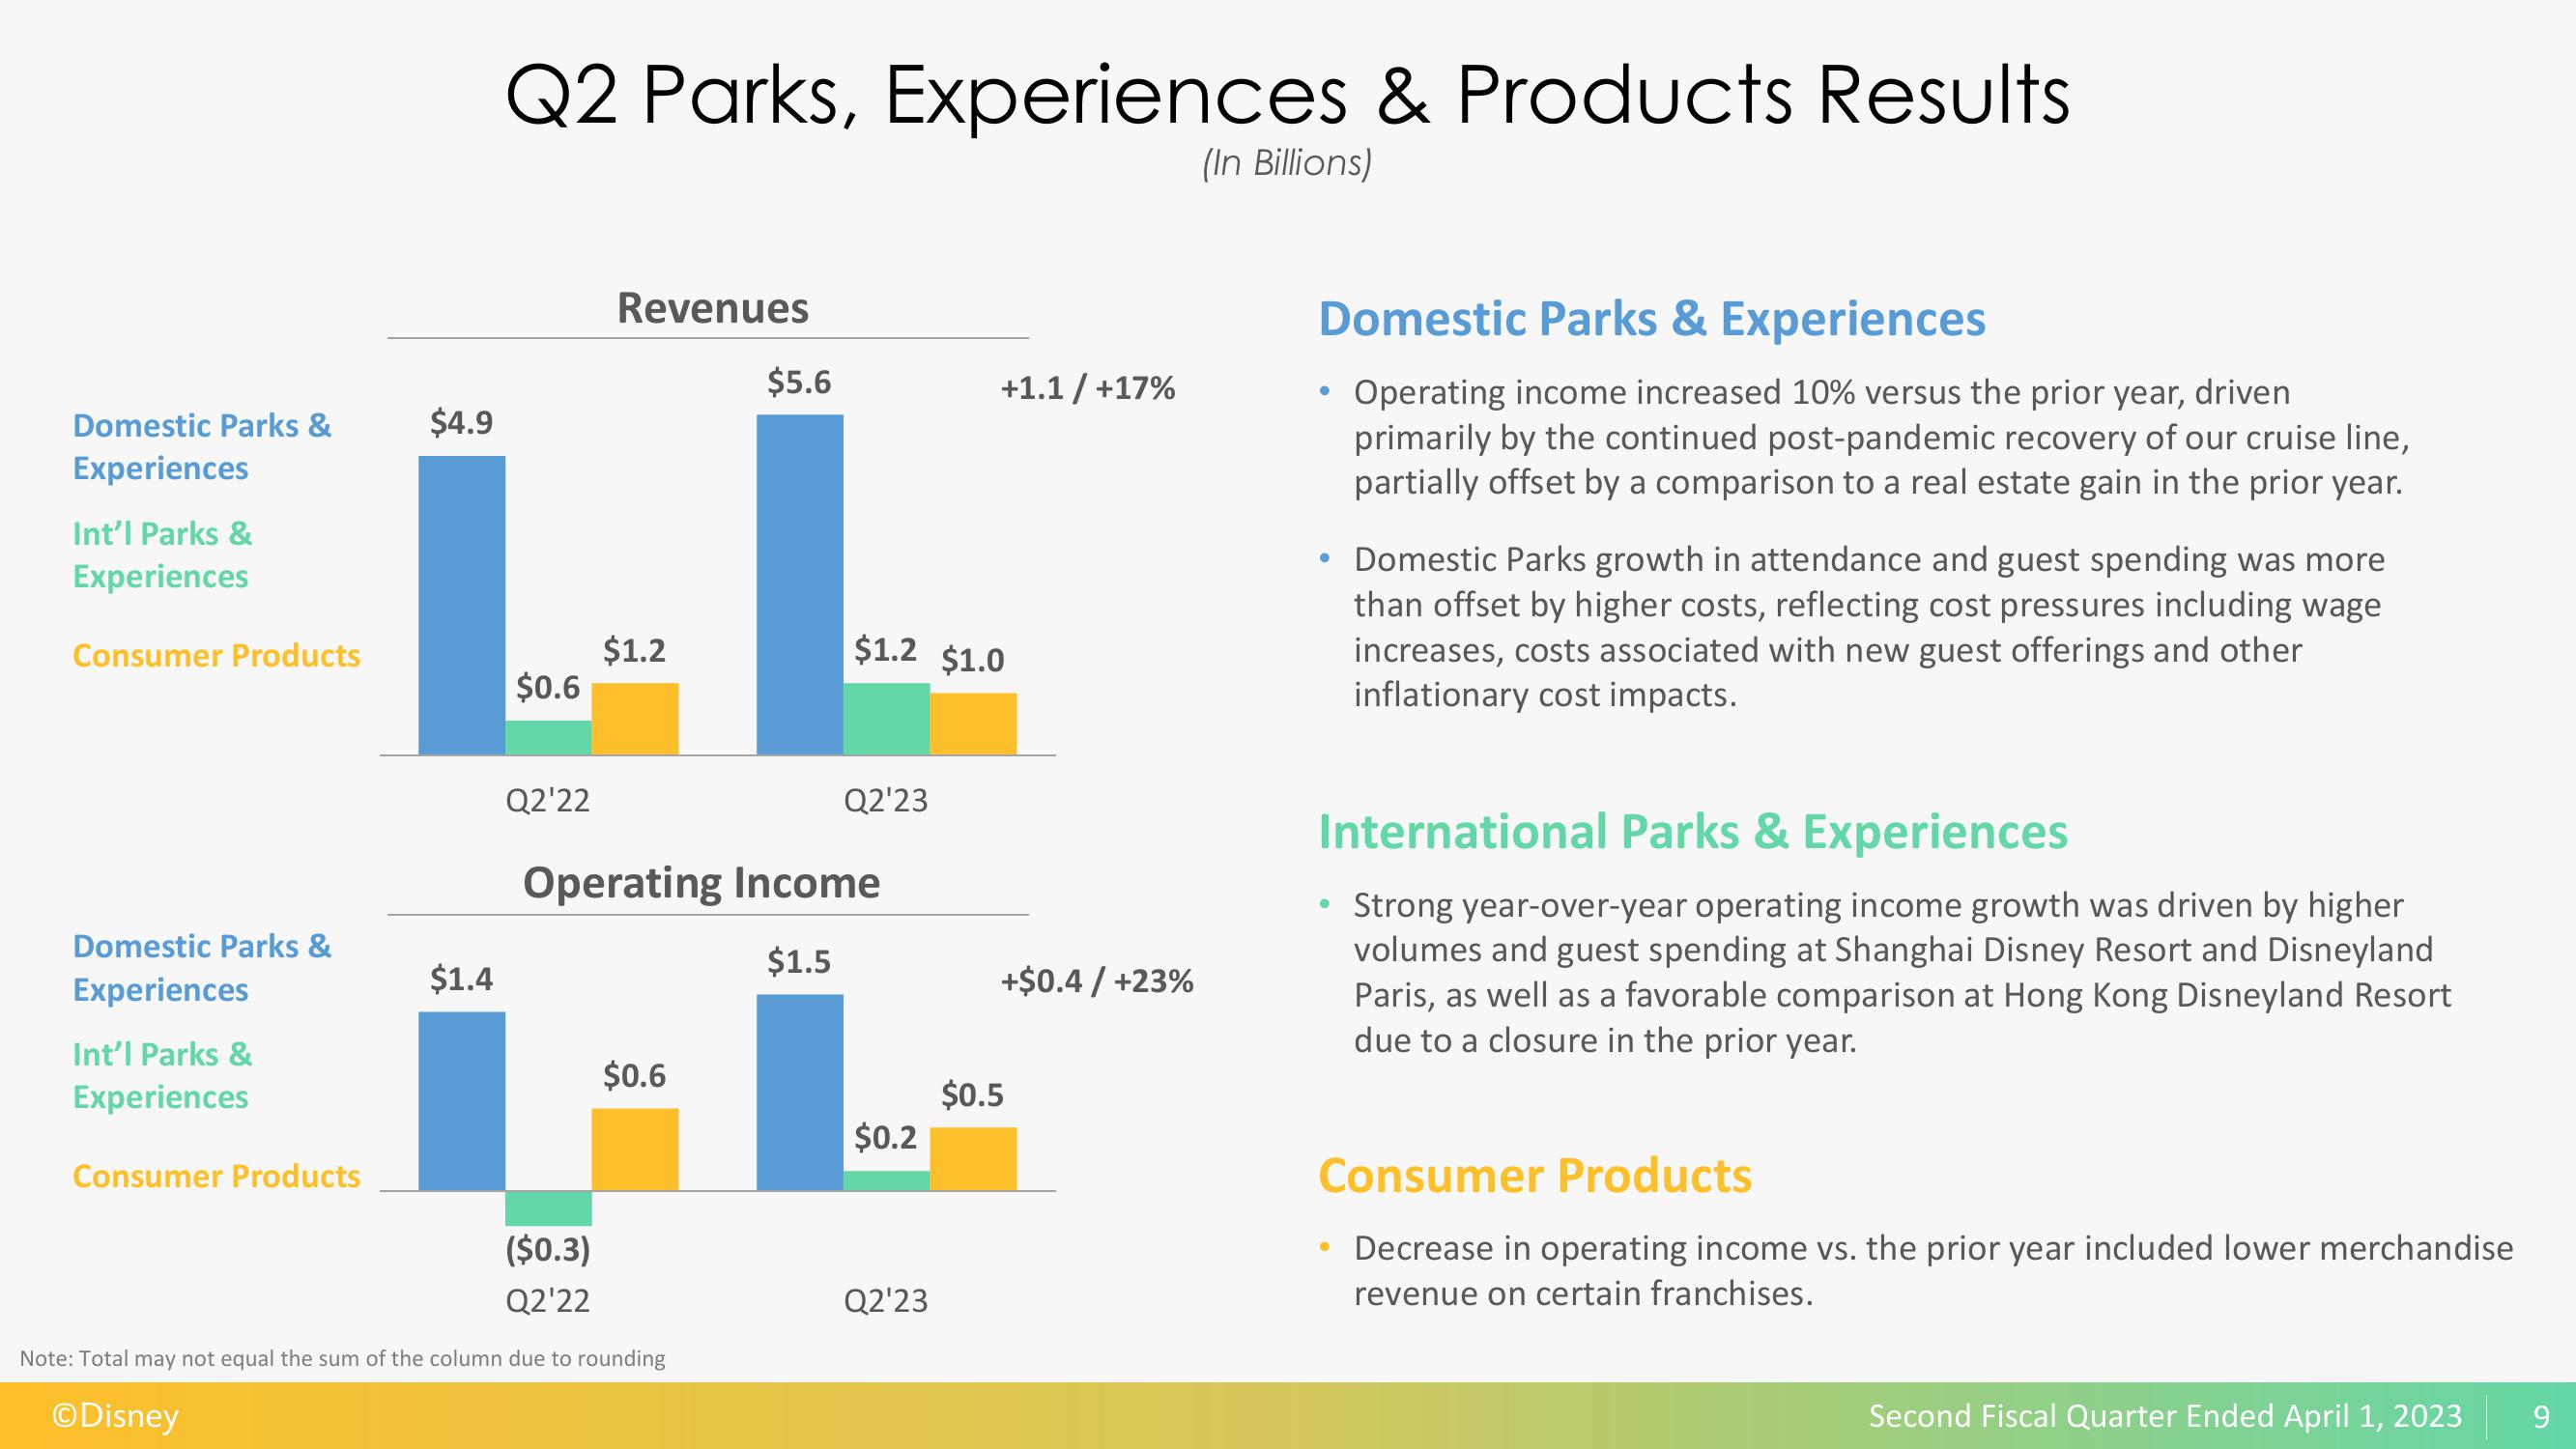
Operating income increased 10% versus the prior year, driven
primarily by the continued post-pandemic recovery of our cruise line,
partially offset by a comparison to a real estate gain in the prior year.
●
Domestic Parks growth in attendance and guest spending was more
than offset by higher costs, reflecting cost pressures including wage
increases, costs associated with new guest offerings and other
inflationary cost impacts.
International Parks & Experiences
Strong year-over-year operating income growth was driven by higher
volumes and guest spending at Shanghai Disney Resort and Disneyland
Paris, as well as a favorable comparison at Hong Kong Disneyland Resort
due to a closure in the prior year.
●
Consumer Products
Decrease in operating income vs. the prior year included lower merchandise
revenue on certain franchises.
Second Fiscal Quarter Ended April 1, 2023
9View entire presentation