Annual General Meeting
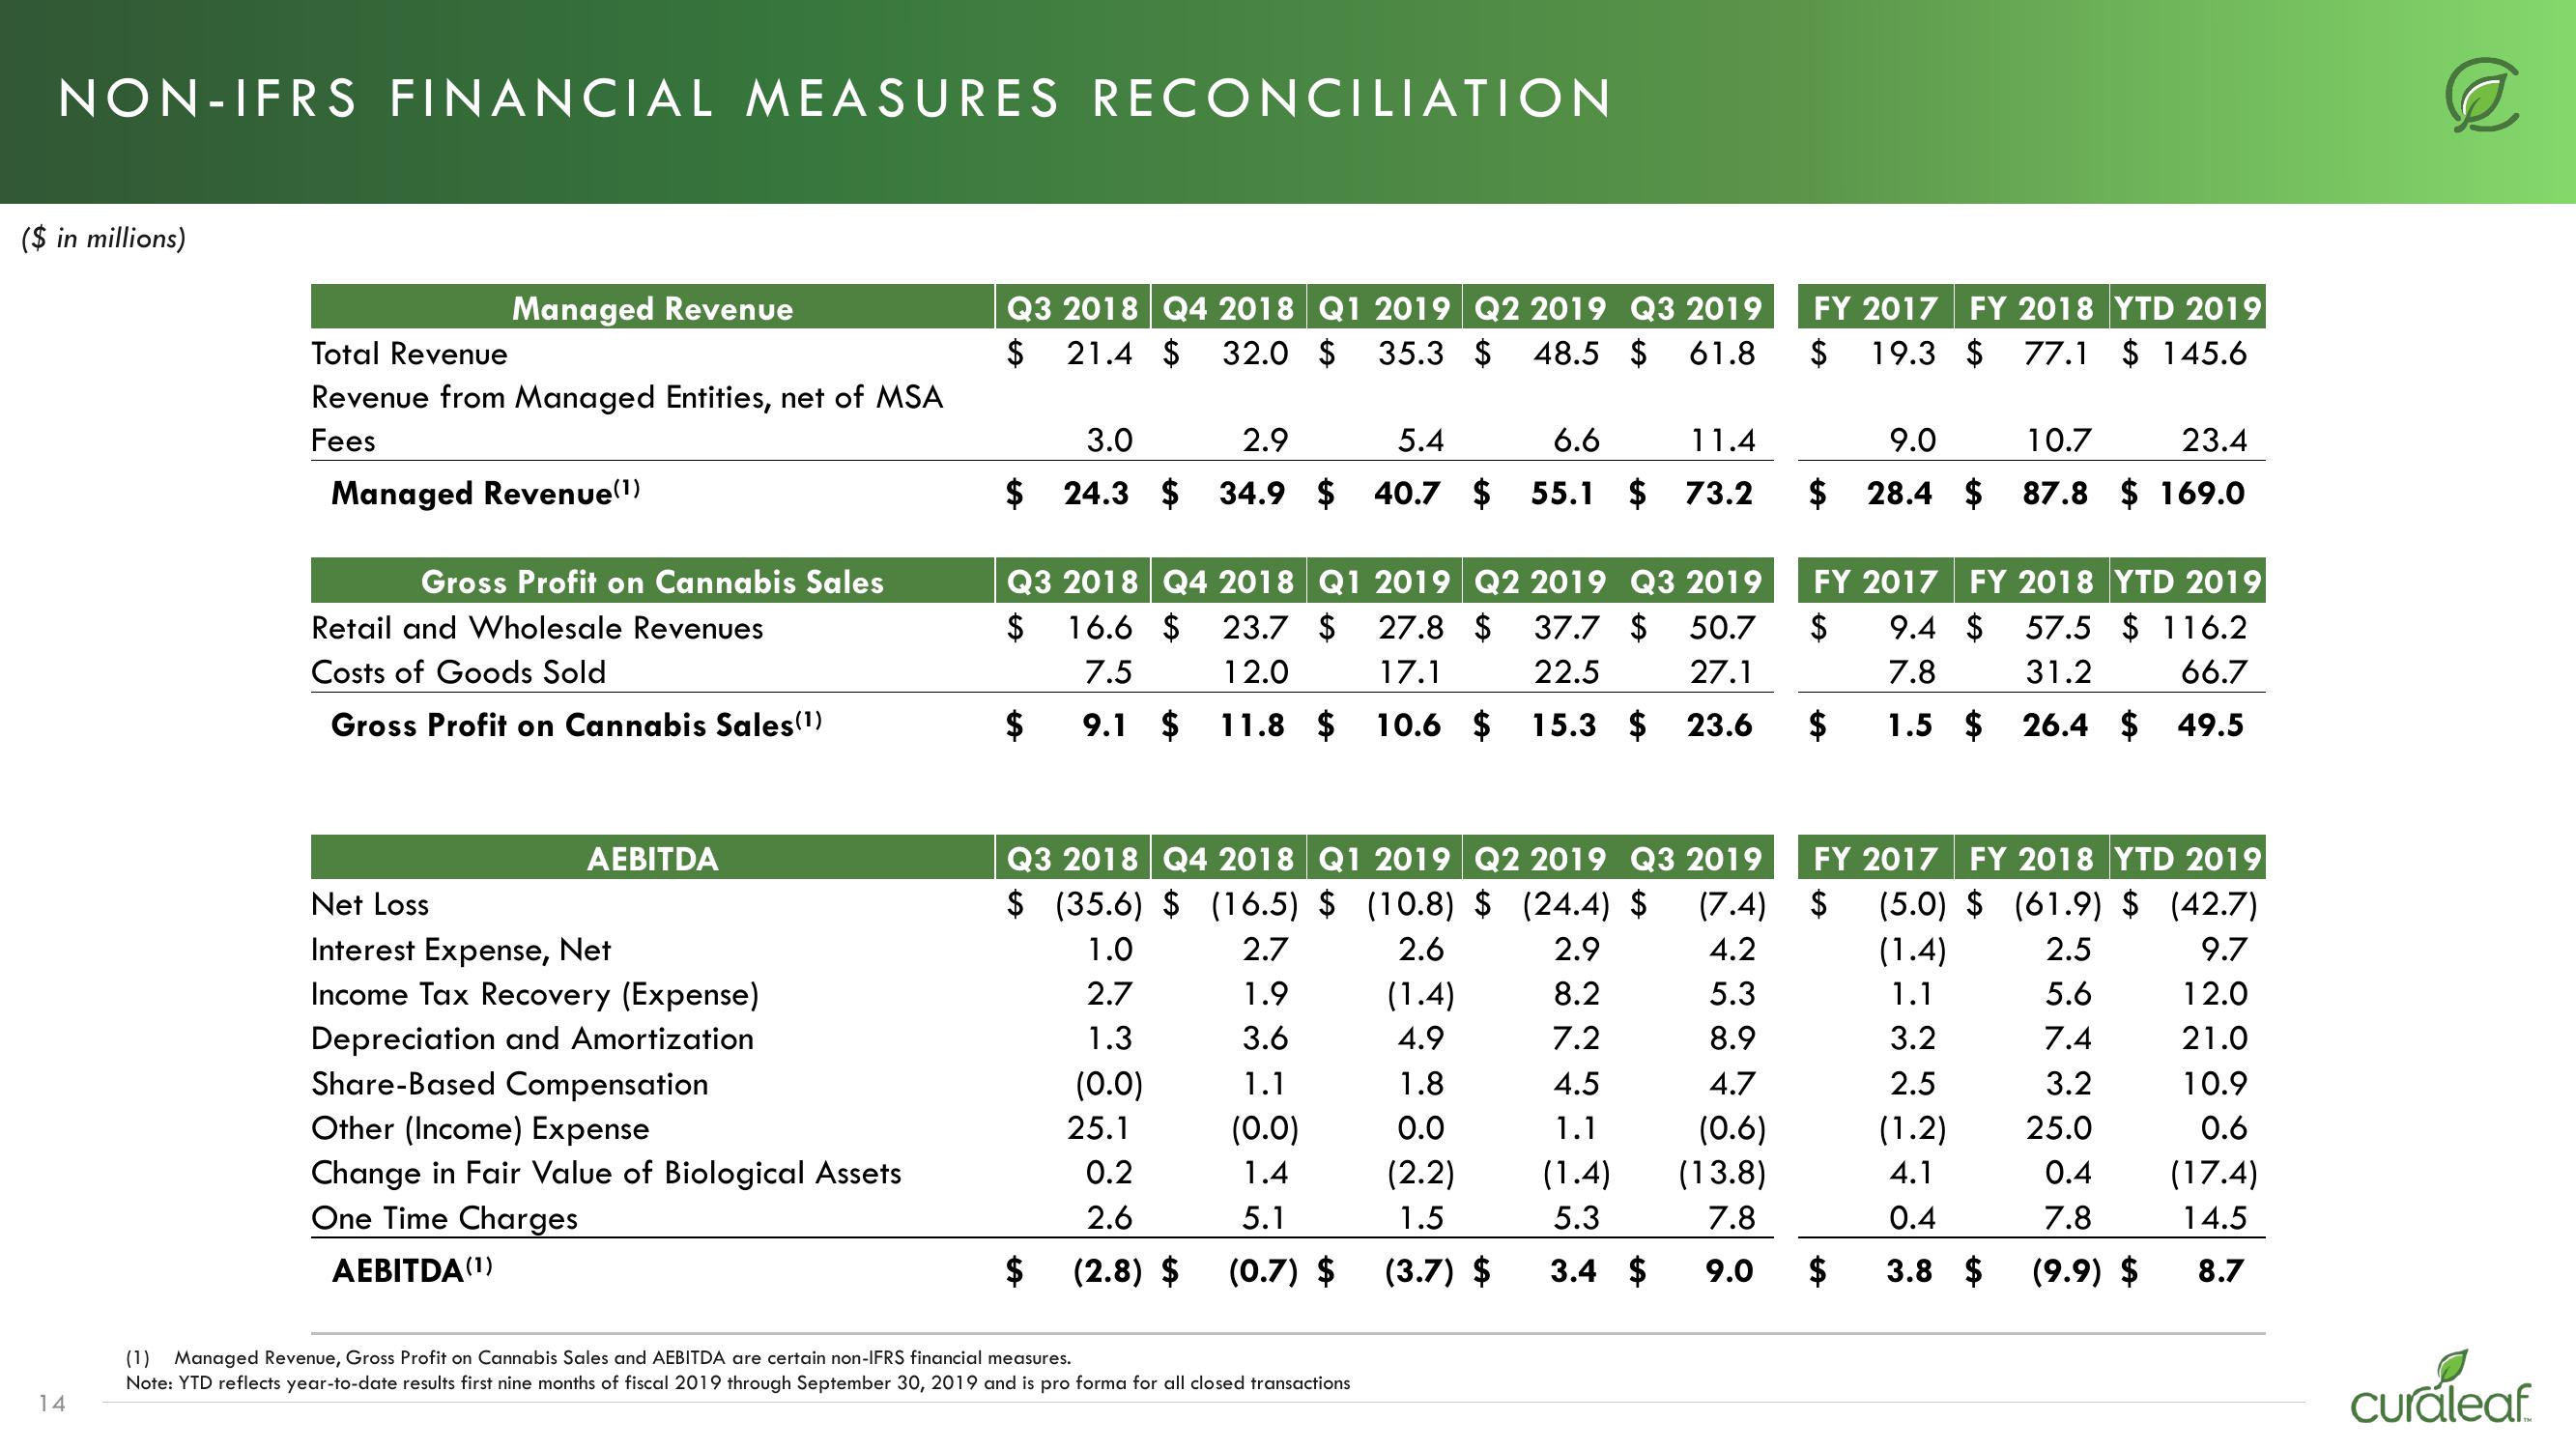
NON-IFRS FINANCIAL MEASURES RECONCILIATION
($ in millions)
14
Managed Revenue
Total Revenue
Revenue from Managed Entities, net of MSA
Fees
Managed Revenue(¹)
Gross Profit on Cannabis Sales
Retail and Wholesale Revenues
Costs of Goods Sold
Gross Profit on Cannabis Sales(¹)
AEBITDA
Net Loss
Interest Expense, Net
Income Tax Recovery (Expense)
Depreciation and Amortization
Share-Based Compensation
Other (Income) Expense
Change in Fair Value of Biological Assets
One Time Charges
AEBITDA (¹)
Q3 2018 Q4 2018 Q1 2019 Q2 2019 Q3 2019
$ 21.4 $ 32.0 $ 35.3 $ 48.5 $ 61.8
3.0
2.9
5.4
6.6
11.4
$ 24.3 $34.9 $ 40.7 $ 55.1 $ 73.2
Q3 2018 Q4 2018 Q1 2019 Q2 2019 Q3 2019
$ 16.6 $ 23.7 $ 27.8 $ 37.7 $ 50.7
7.5 12.0 17.1
22.5 27.1
9.1 $ 11.8 $ 10.6 $ 15.3 $ 23.6
$
Q3 2018 Q4 2018 Q1 2019 Q2 2019 Q3 2019
$ (35.6) $ (16.5) $ (10.8) $ (24.4) $
1.0
2.7
2.6
2.9
2.7
1.9
8.2
1.3
3.6
7.2
(0.0)
1.1
4.5
(0.0)
1.4
5.1
(0.7) $
25.1
0.2
2.6
(2.8) $
(1) Managed Revenue, Gross Profit on Cannabis Sales and AEBITDA are certain non-IFRS financial measures.
Note: YTD reflects year-to-date results first nine months of fiscal 2019 through September 30, 2019 and is pro forma for all closed transactions
(1.4)
4.9
1.8
0.0
(2.2)
1.5
(3.7) $
FY 2017 FY 2018 YTD 2019
$ 19.3 $ 77.1 $ 145.6
9.0 10.7 23.4
$28.4 $ 87.8 $ 169.0
FY 2017 FY 2018 YTD 2019
$
9.4 $ 57.5 $116.2
7.8 31.2 66.7
1.5 $ 26.4 $49.5
$
FY 2017 FY 2018 YTD 2019
(5.0) $ (61.9) $ (42.7)
(1.4)
2.5
9.7
1.1
5.6
12.0
3.2
7.4
21.0
2.5
3.2
10.9
(1.2) 25.0
0.6
4.1
0.4
0.4
7.8
(17.4)
14.5
3.8 $
(9.9) $
8.7
(7.4) $
4.2
5.3
8.9
4.7
1.1
(0.6)
(1.4)
(13.8)
5.3
7.8
3.4 $ 9.0
$
curaleafView entire presentation