Spotify Results Presentation Deck
Executive Summary
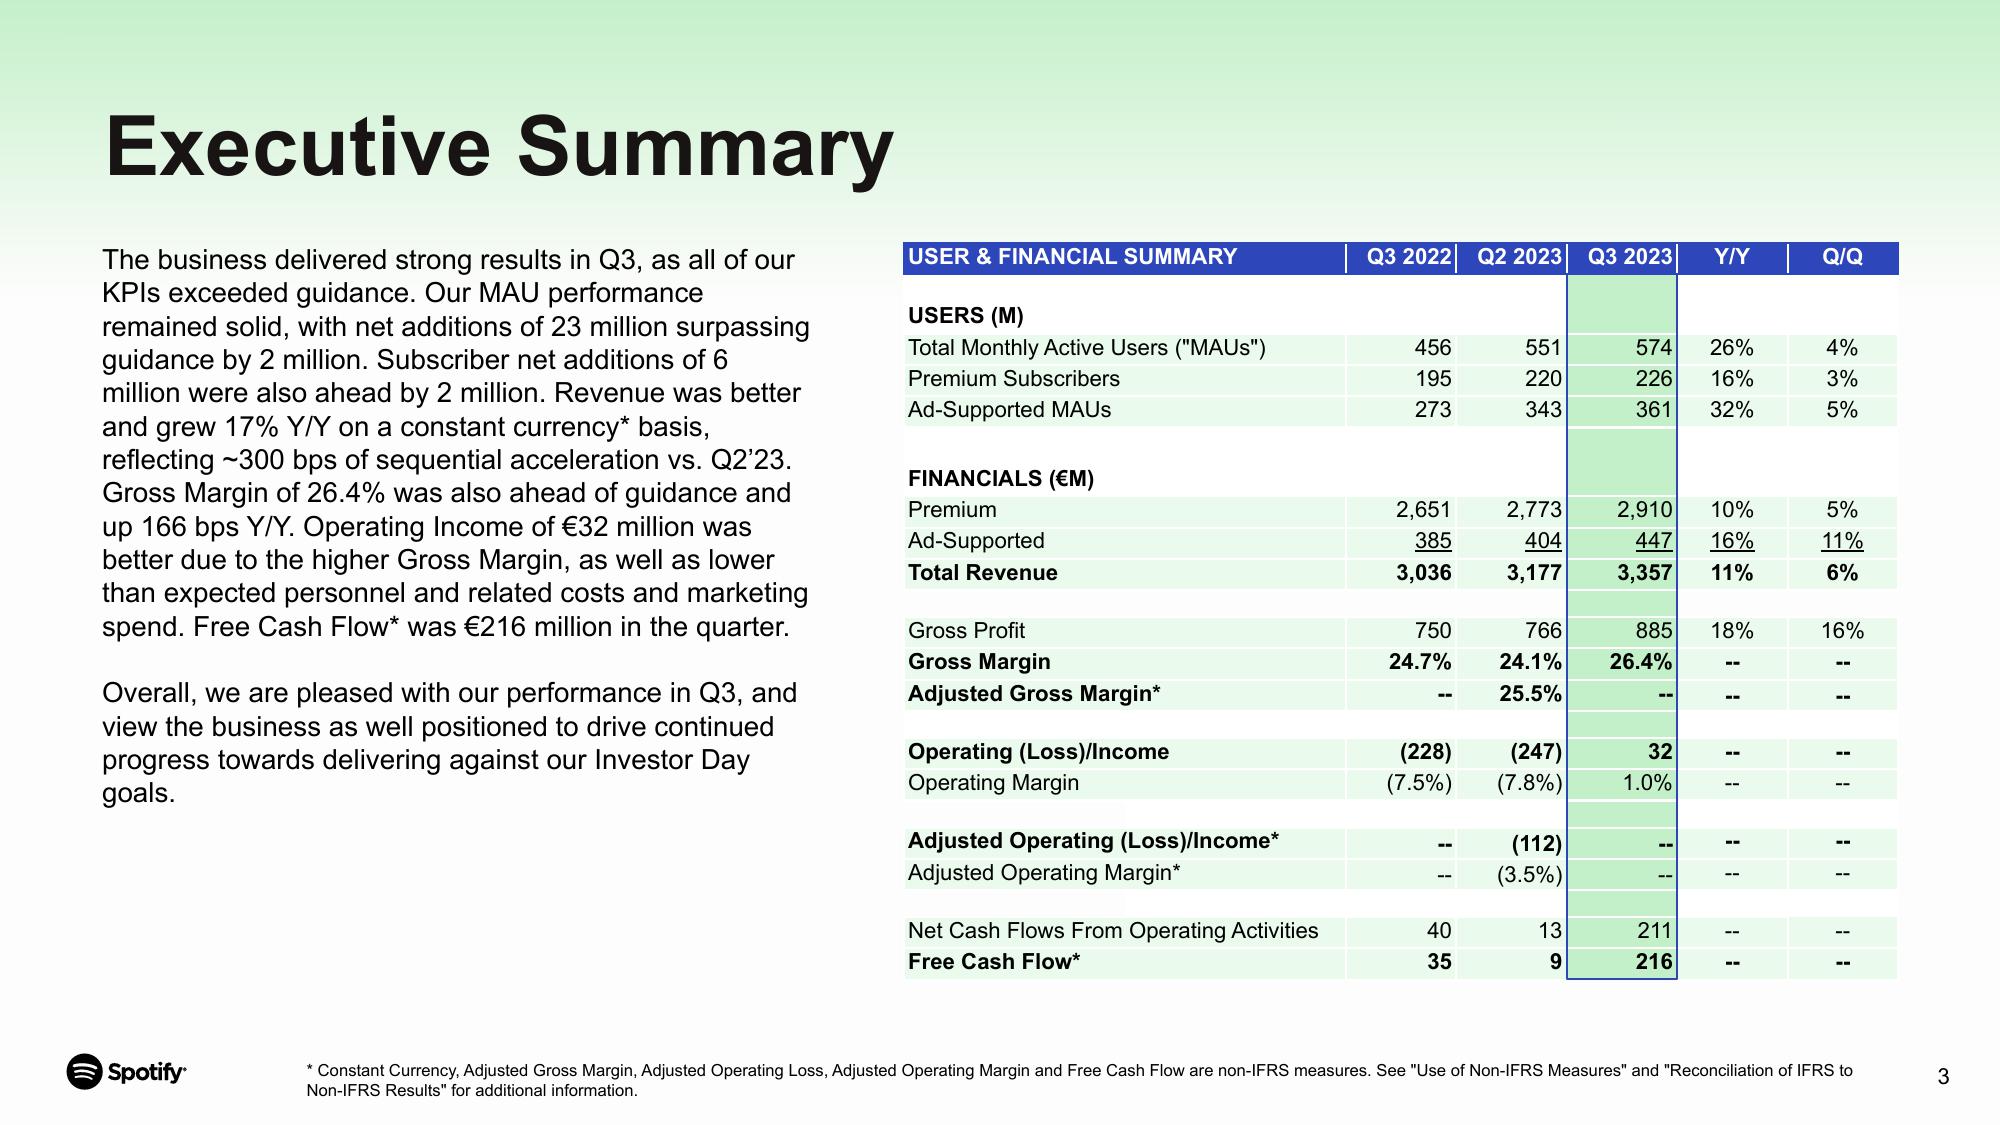
The business delivered strong results in Q3, as all of our
KPIs exceeded guidance. Our MAU performance
remained solid, with net additions of 23 million surpassing
guidance by 2 million. Subscriber net additions of 6
million were also ahead by 2 million. Revenue was better
and grew 17% Y/Y on a constant currency* basis,
reflecting ~300 bps of sequential acceleration vs. Q2'23.
Gross Margin of 26.4% was also ahead of guidance and
up 166 bps Y/Y. Operating Income of €32 million was
better due to the higher Gross Margin, as well as lower
than expected personnel and related costs and marketing
spend. Free Cash Flow* was €216 million in the quarter.
Overall, we are pleased with our performance in Q3, and
view the business as well positioned to drive continued
progress towards delivering against our Investor Day
goals.
Spotify
USER & FINANCIAL SUMMARY
USERS (M)
Total Monthly Active Users ("MAUS")
Premium Subscribers
Ad-Supported MAUS
FINANCIALS (€M)
Premium
Ad-Supported
Total Revenue
Gross Profit
Gross Margin
Adjusted Gross Margin*
Operating (Loss)/Income
Operating Margin
Adjusted Operating (Loss)/Income*
Adjusted Operating Margin*
Net Cash Flows From Operating Activities
Free Cash Flow*
Q3 2022 Q2 2023 Q3 2023
456
195
273
2,651
385
3,036 3,177
2,773
404
750
24.7%
1
(228)
(7.5%)
551
220
343
40
35
766
24.1%
25.5%
(247)
(7.8%)
(112)
(3.5%)
39
13
574 26%
226
16%
361
32%
2,910
447
3,357
885
26.4%
1
32
1.0%
1
L
Y/Y
211
216
10%
16%
11%
18%
1
11
11
Q/Q
4%
3%
5%
5%
11%
6%
16%
* Constant Currency, Adjusted Gross Margin, Adjusted Operating Loss, Adjusted Operating Margin and Free Cash Flow are non-IFRS measures. See "Use of Non-IFRS Measures" and "Reconciliation of IFRS to
Non-IFRS Results" for additional information.
3View entire presentation