Origo Results Presentation Deck
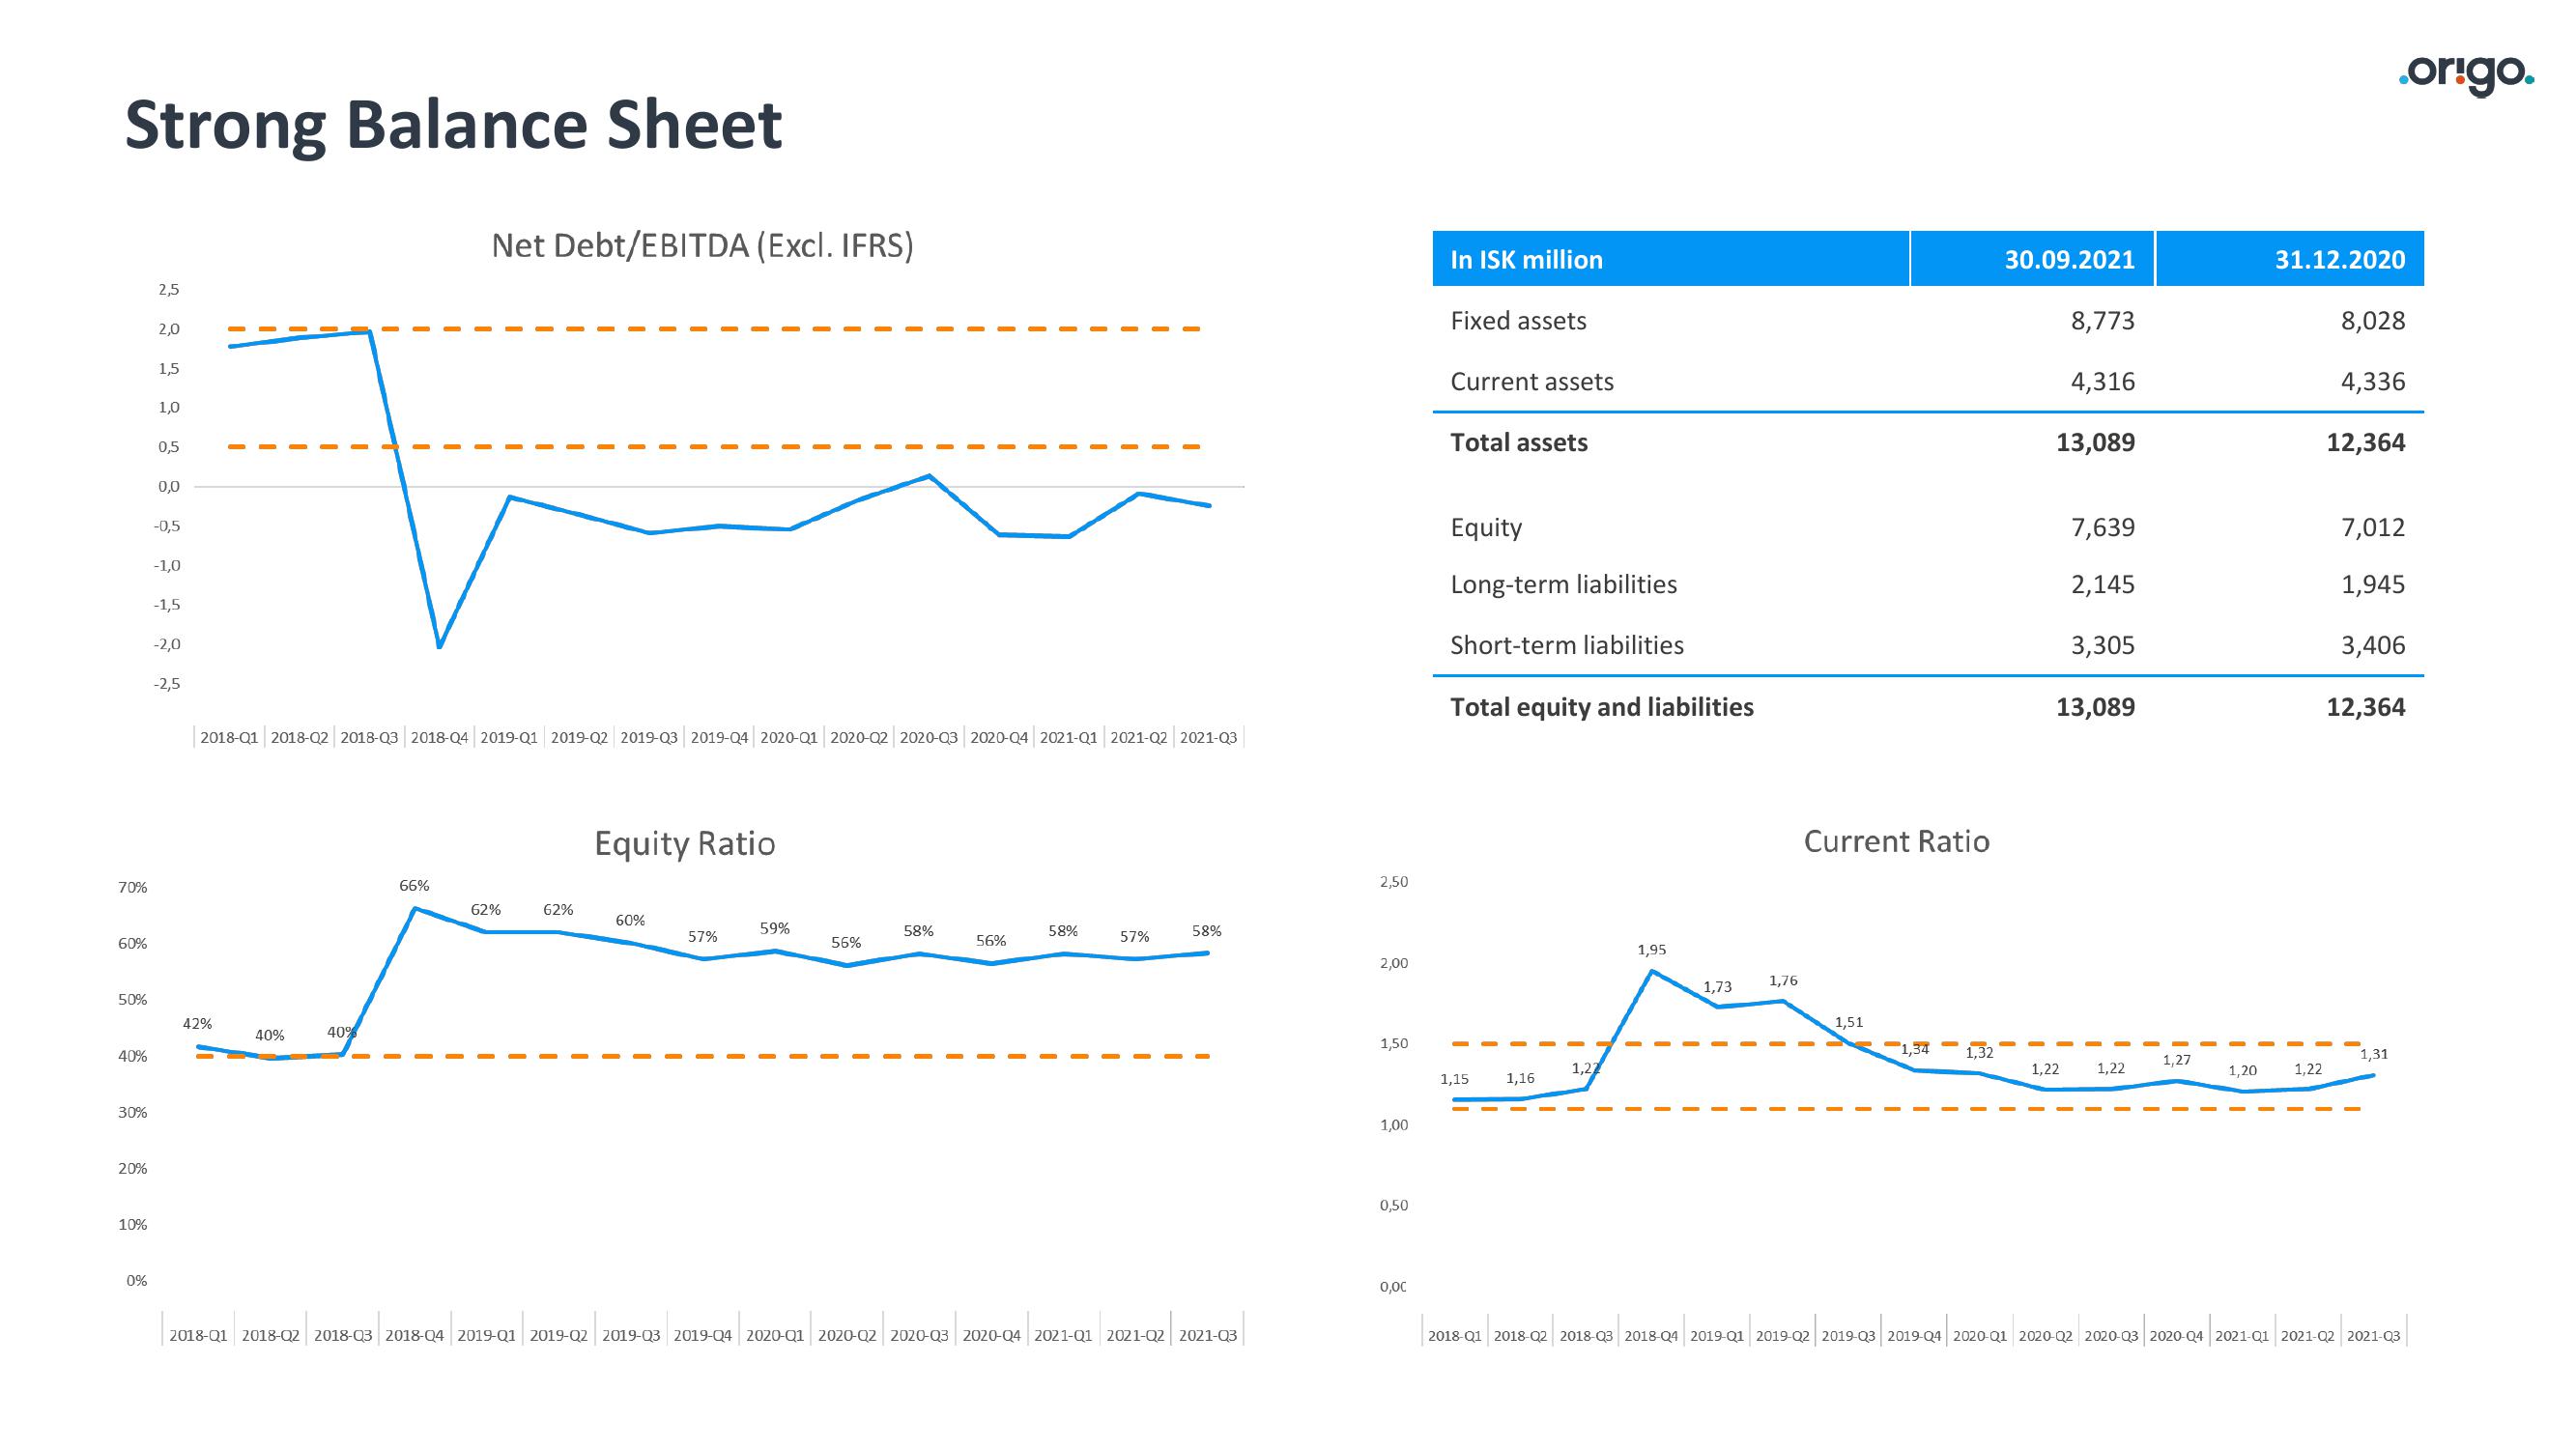
Strong Balance Sheet
70%
60%
50%
40%
30%
20%
10%
0%
2,5
2,0
1,5
1,0
0,5
0,0
-0,5
-1,0
-1,5
-2,0
-2,5
2018-Q1 2018-02 2018-Q3 2018-Q4 2019-Q1 2019-Q2 2019-Q3 2019-Q4 2020-Q1 2020-02 2020-Q3 2020-Q4 2021-Q1 2021-Q2 2021-Q3
42%
40%
40%
Net Debt/EBITDA (Excl. IFRS)
66%
62%
62%
Equity Ratio
60%
57%
59%
56%
58%
56%
58%
57%
58%
2018-Q1 2018-Q2 2018-Q3 2018-Q4 2019-Q1 2019-Q2 2019-Q3 2019-Q4 2020-Q1 2020-Q2 2020-Q3 2020-Q4 2021-Q1 2021-Q2 2021-Q3
2,50
2,00
1,50
1,00
0,50
0,00
In ISK million
Fixed assets
Current assets
Total assets
Equity
Long-term liabilities
Short-term liabilities
Total equity and liabilities
1,15
1,16
1,22
1,95
1,73
1,76
Current Ratio
1,51
2018-Q1 2018-02 2018-Q3 2018-Q4 2019-Q1 2019-02
1,34
1,32
30.09.2021
8,773
4,316
13,089
7,639
2,145
3,305
13,089
1,22
1,22
1,27
1,20
31.12.2020
1,22
.origo.
8,028
4,336
12,364
7,012
1,945
3,406
12,364
1,31
2 2019-232
2019-Q3 2019-Q4 2020-Q1 2020-Q2 2020-Q3 2020-Q4 2021-Q1 2021-Q2 2021-Q3
4|2021-Q1 2021-QView entire presentation