Experienced Senior Team Overview
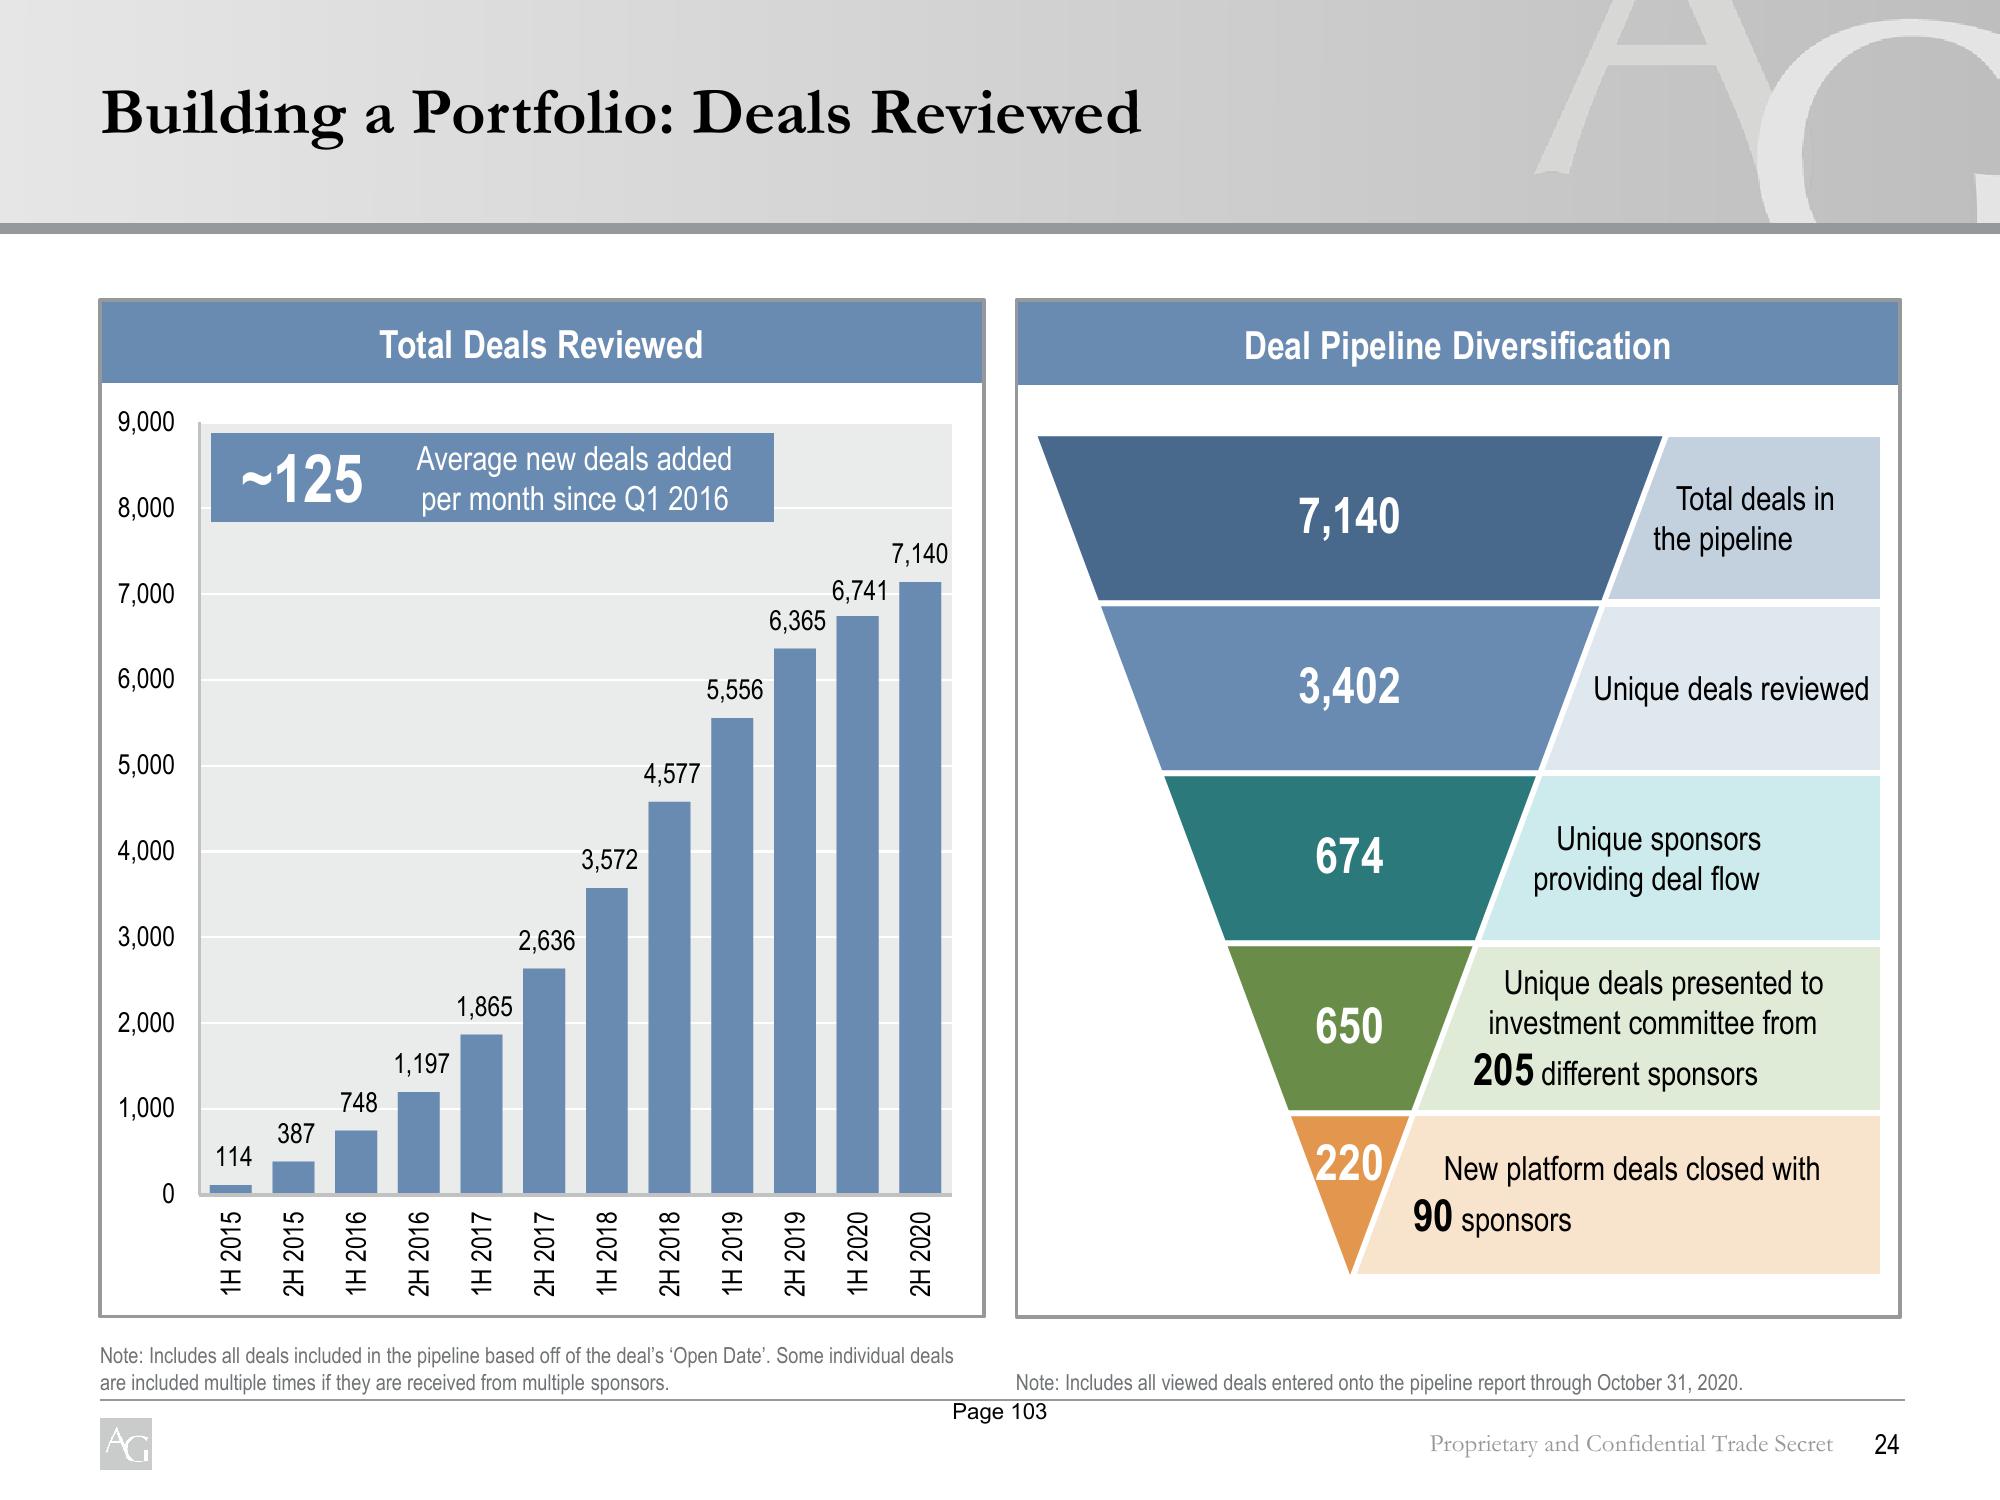
Building a Portfolio: Deals Reviewed
9,000
8,000
7,000
6,000
5,000
4,000
3,000
2,000
1,000
~125 Average new deals added
per month since Q1 2016
114
387
1H 2015
2H 2015
748
Total Deals Reviewed
1H 2016
1,197
2H 2016
1,865
2,636
3,572
4,577
5,556
6,365
1H 2017
2H 2017
1H 2018
2H 2018
1H 2019
2H 2019
6,741
1H 2020
7,140
2H 2020
Note: Includes all deals included in the pipeline based off of the deal's 'Open Date'. Some individual deals
are included multiple times if they are received from multiple sponsors.
AG
Deal Pipeline Diversification
7,140
3,402
674
650
n
220
Total deals in
the pipeline
Unique deals reviewed
Unique sponsors
providing deal flow
Unique deals presented to
investment committee from
205 different sponsors
New platform deals closed with
90 sponsors
Note: Includes all viewed deals entered onto the pipeline report through October 31, 2020.
Page 103
Proprietary and Confidential Trade Secret
24View entire presentation