Carlyle Investor Day Presentation Deck
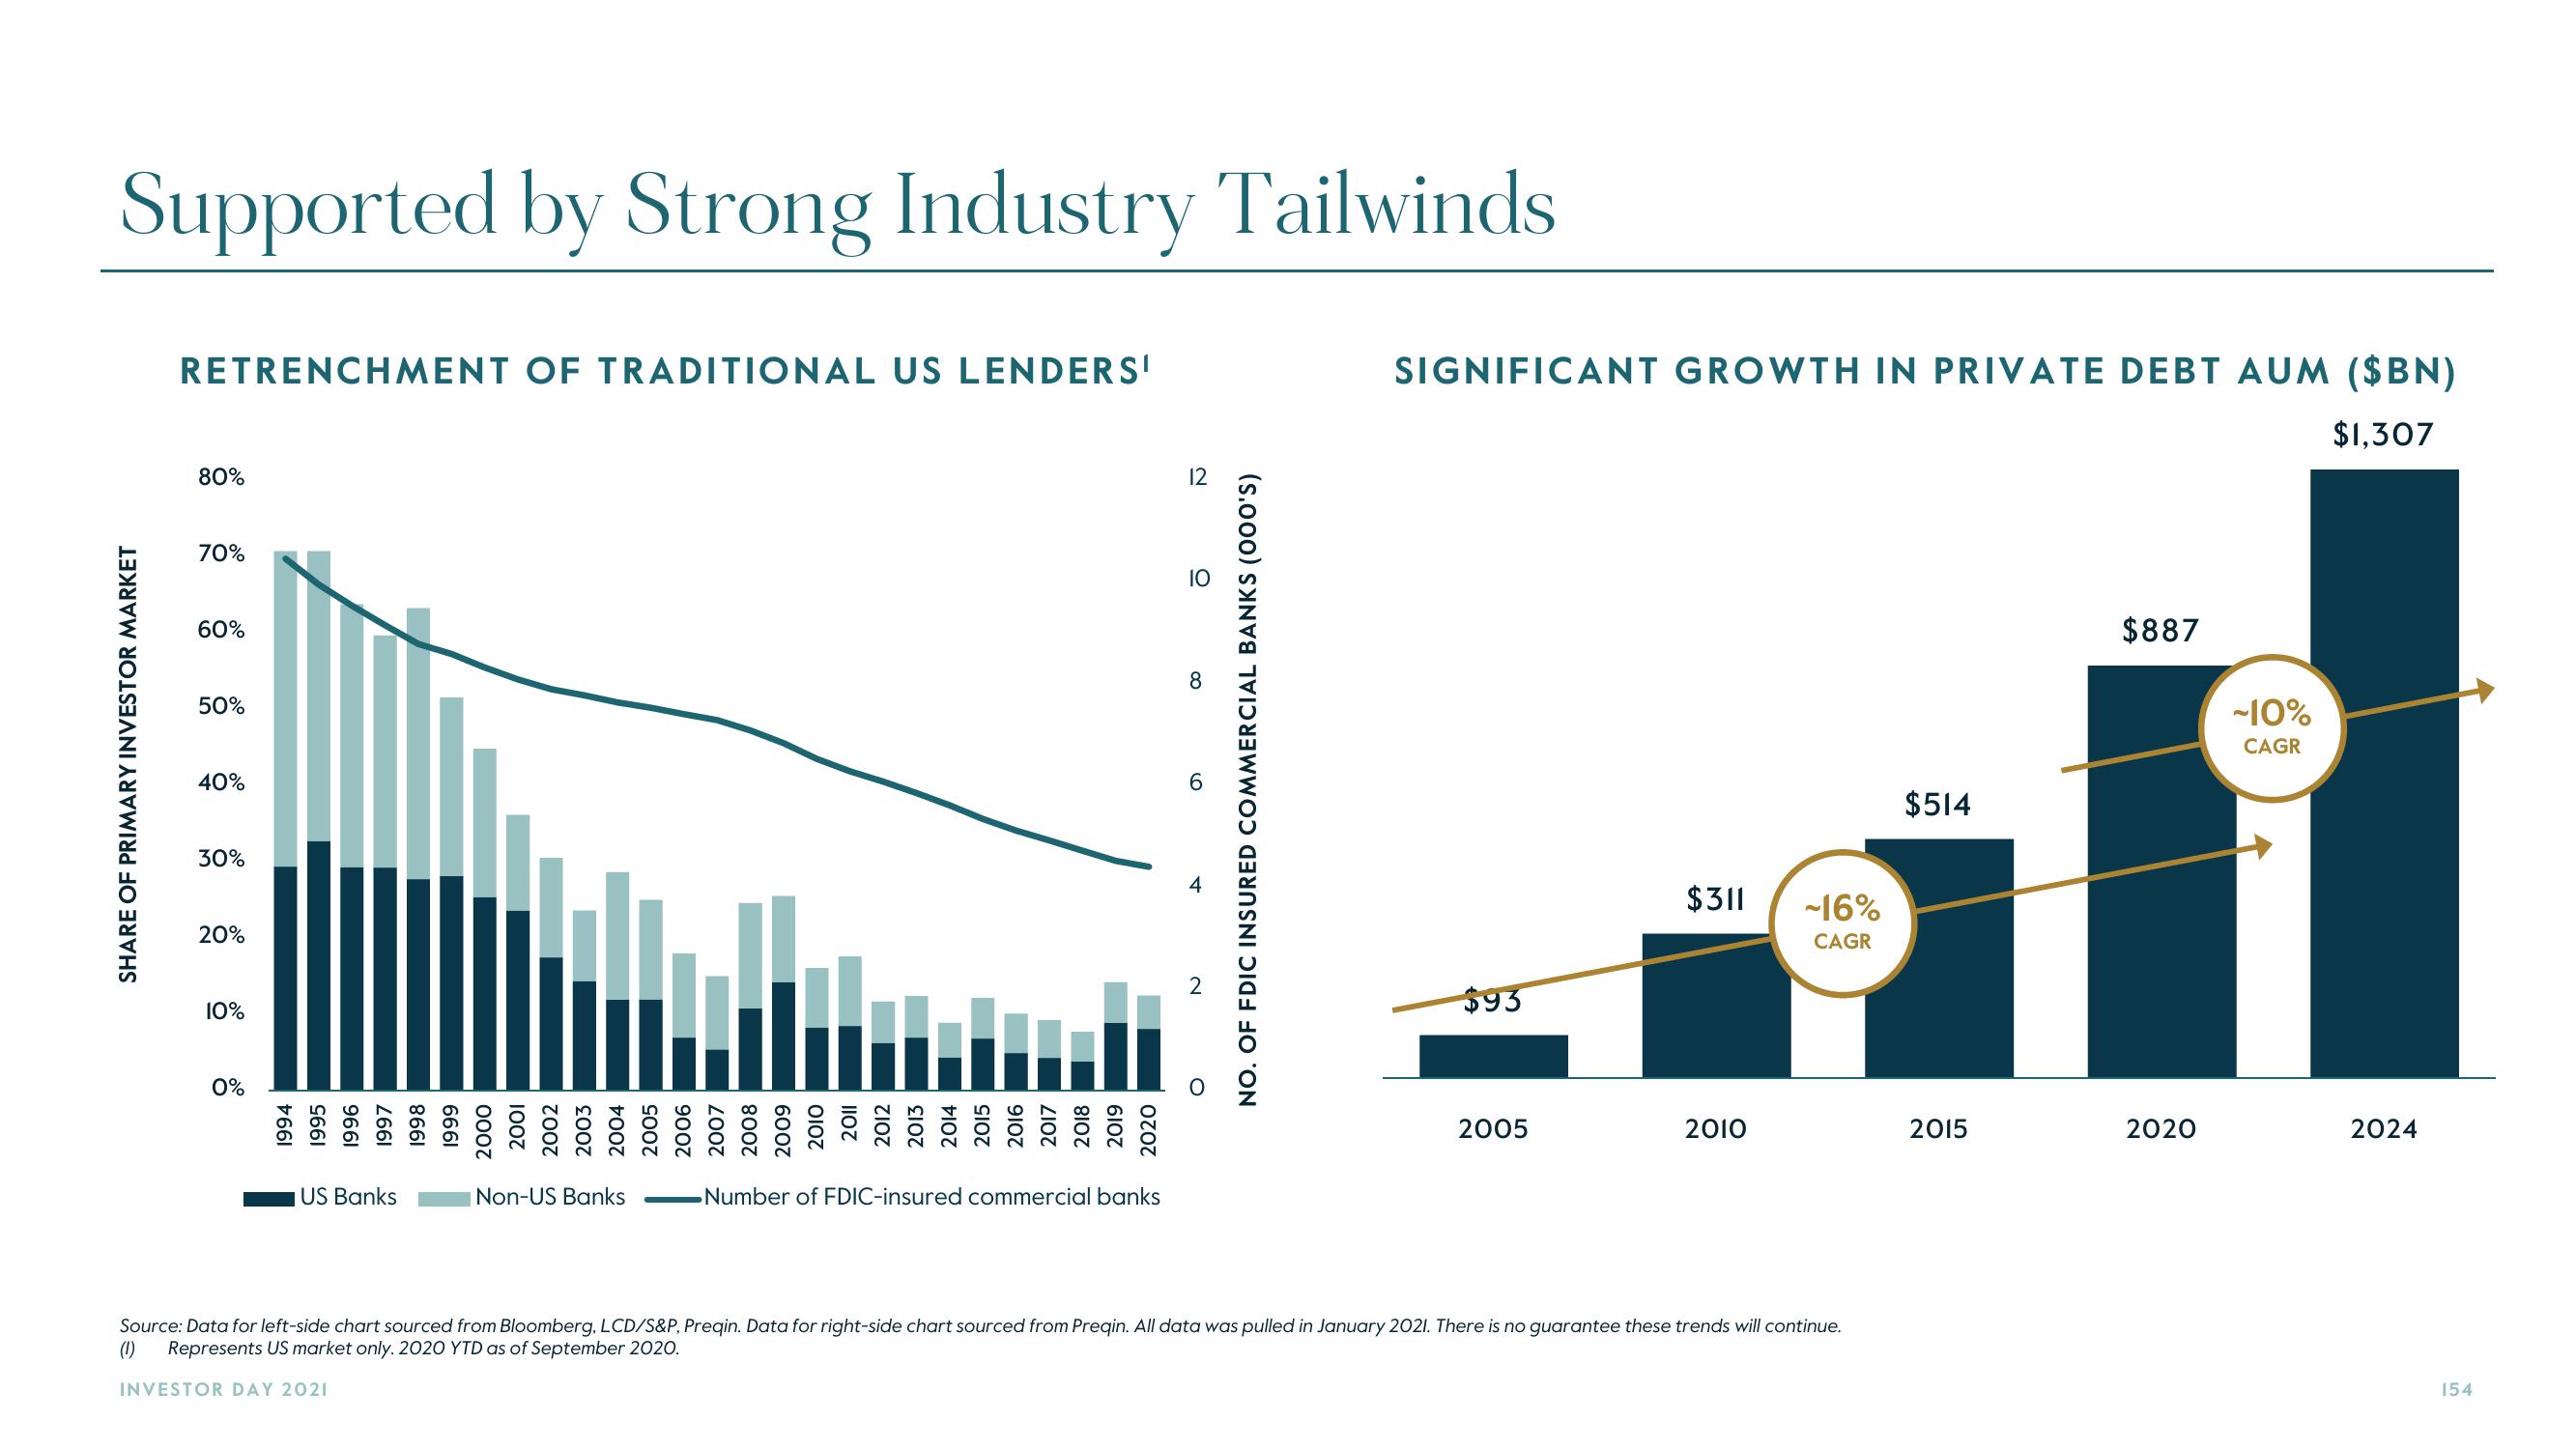
Supported by Strong Industry Tailwinds
SHARE OF PRIMARY INVESTOR MARKET
RETRENCHMENT OF TRADITIONAL US LENDERS'
80%
70%
60%
50%
40%
30%
20%
10%
0%
1994
1995
1996
1997
1998
US Banks
1999
2000
2001
2002
2003
2004
2005
2006
2007
2008
2009
2010
2011
2012
2013
2014
2015
2016
2017
2018
2019
2020
Non-US Banks
Number of FDIC-insured commercial banks
12
10
8
6
2
O
NO. OF FDIC INSURED COMMERCIAL BANKS (000'S)
SIGNIFICANT GROWTH IN PRIVATE DEBT AUM ($BN)
$1,307
$93
2005
$311
2010
-16%
CAGR
Source: Data for left-side chart sourced from Bloomberg, LCD/S&P, Preqin. Data for right-side chart sourced from Preqin. All data was pulled in January 2021. There is no guarantee these trends will continue.
(1) Represents US market only. 2020 YTD as of September 2020.
INVESTOR DAY 2021
$514
2015
$887
2020
-10%
CAGR
2024
154View entire presentation