BAT Results Presentation Deck
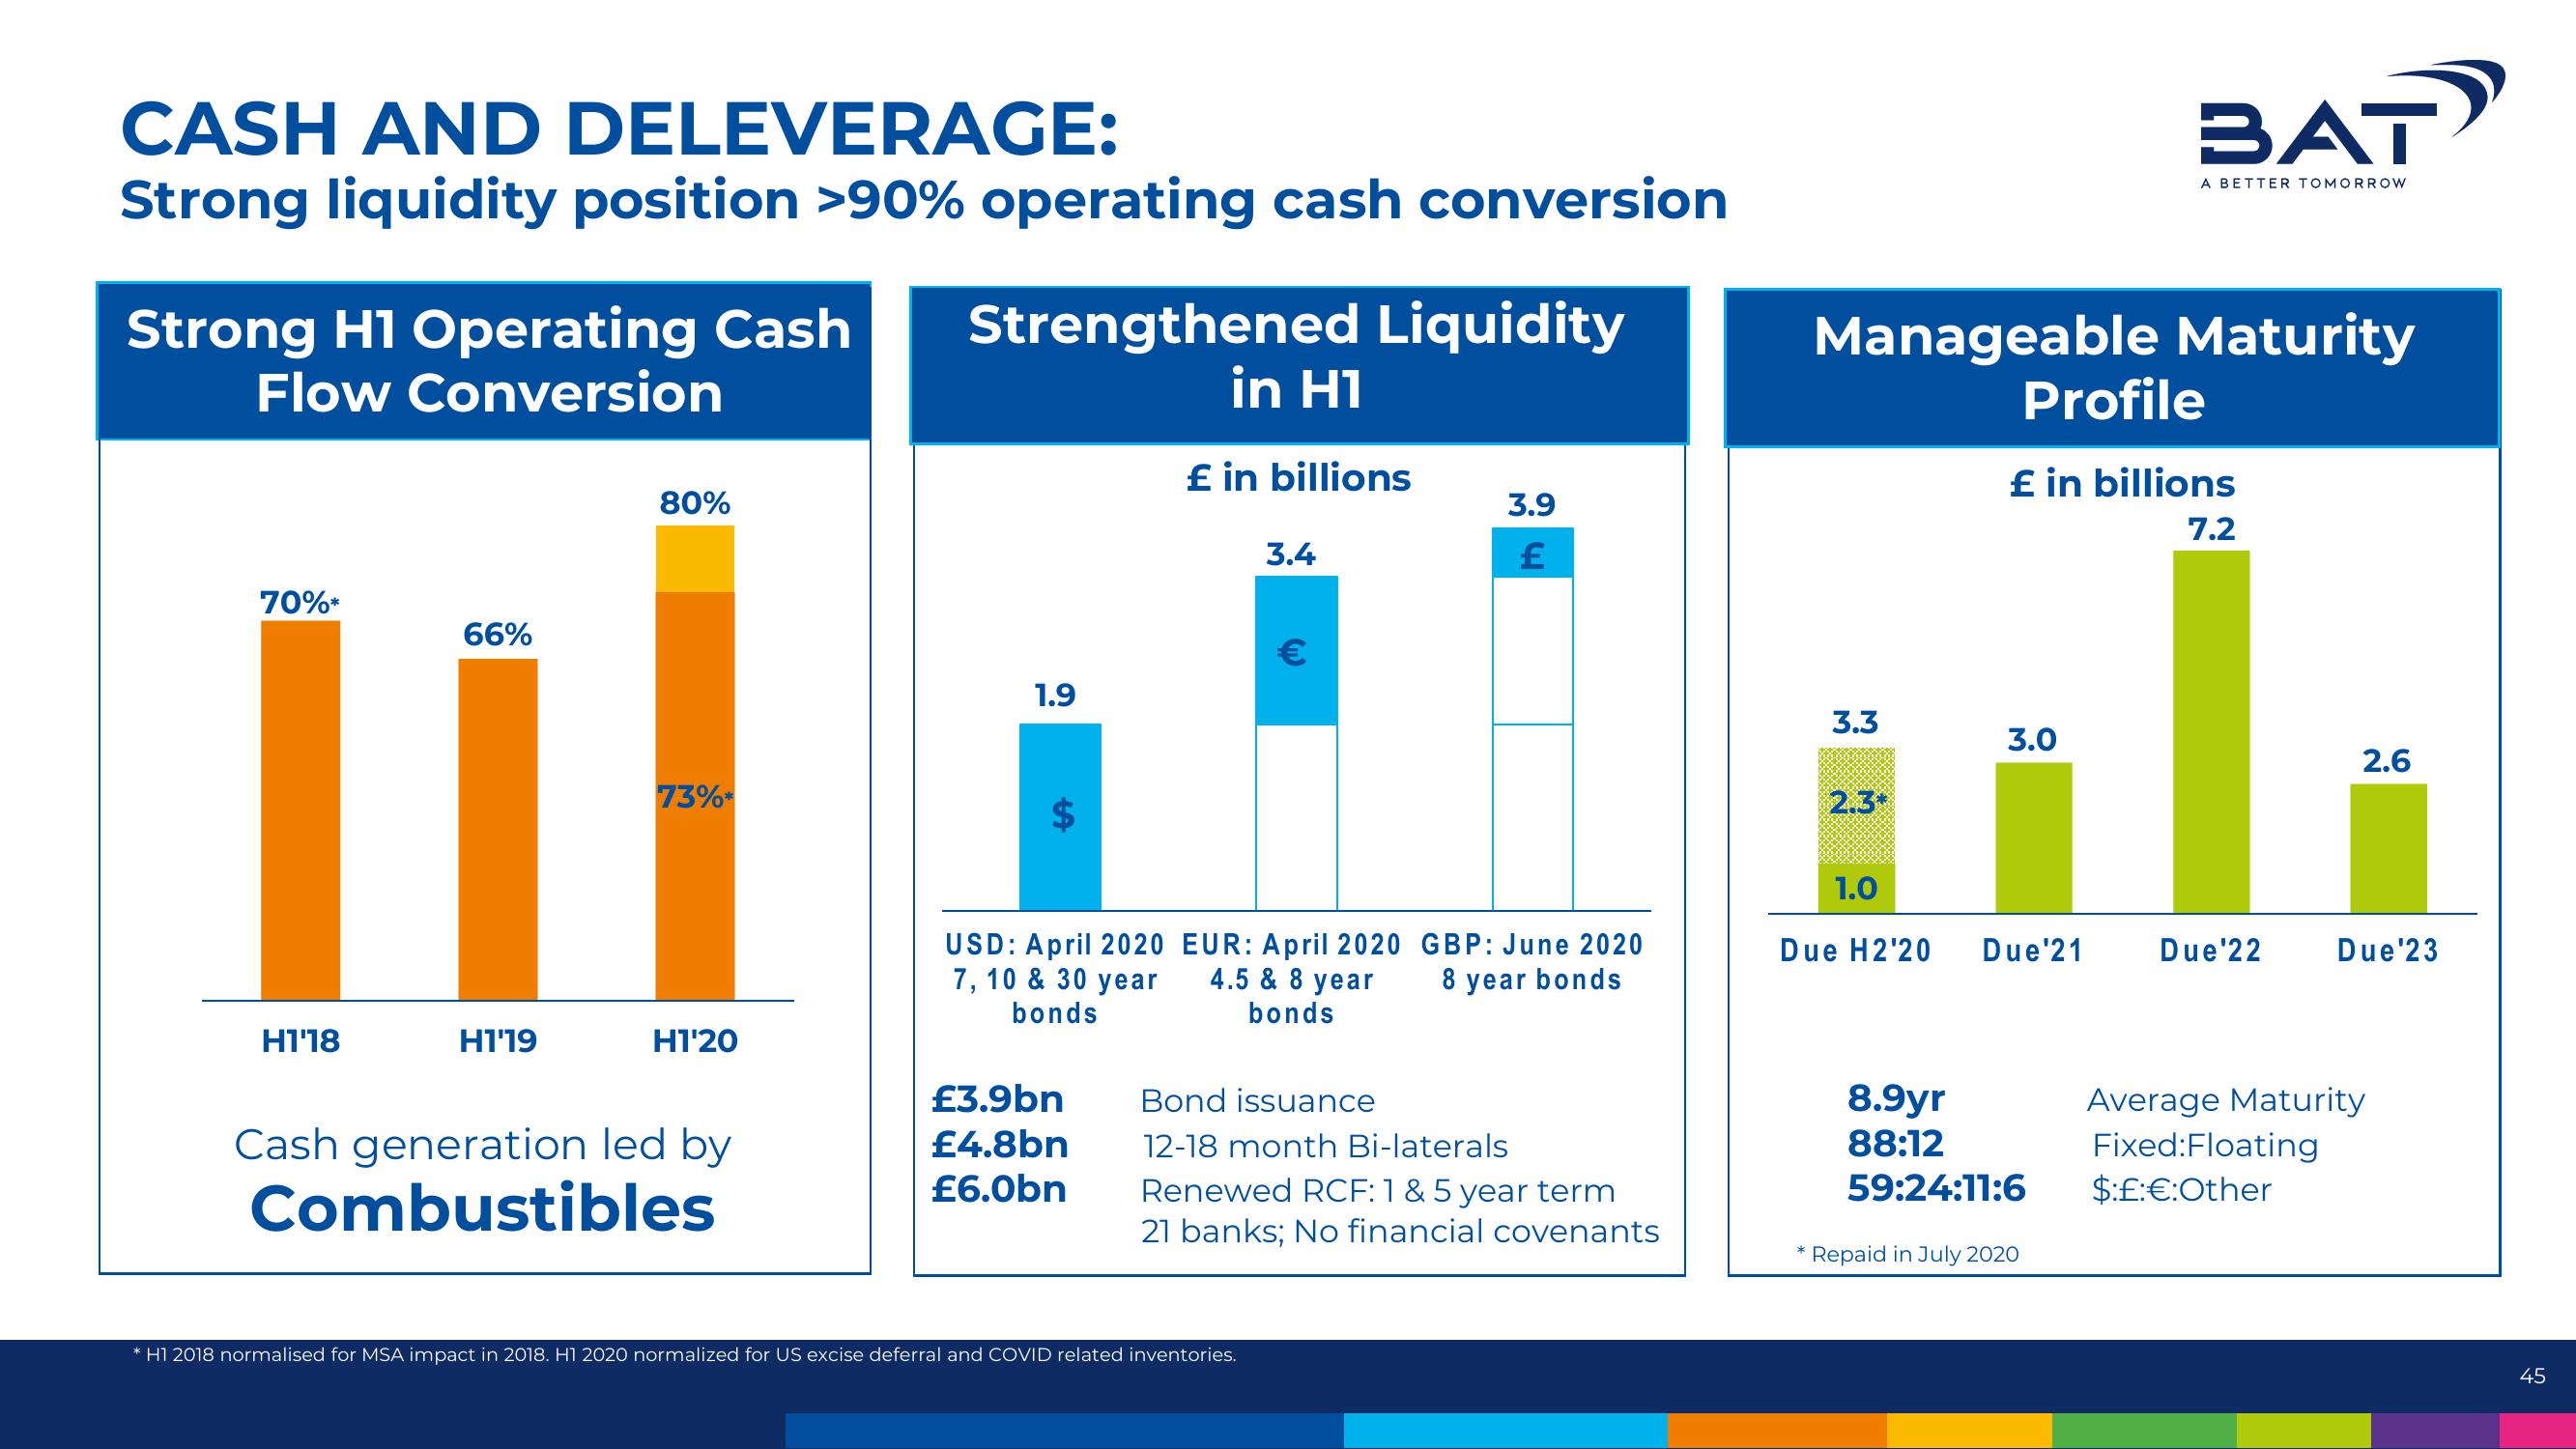
CASH AND DELEVERAGE:
Strong liquidity position >90% operating cash conversion
Strong H1 Operating Cash Strengthened Liquidity
Flow Conversion
in H1
£ in billions
70%*
H118
66%
H119
80%
73%*
H120
Cash generation led by
Combustibles
1.9
USD: April 2020
7, 10 & 30 year
bonds
£3.9bn
£4.8bn
£6.0bn
3.4
EUR: April 2020
4.5 & 8 year
bonds
* H1 2018 normalised for MSA impact in 2018. H1 2020 normalized for US excise deferral and COVID related inventories.
3.9
£
GBP: June 2020
8 year bonds
Bond issuance
12-18 month Bi-laterals
Renewed RCF: 1 & 5 year term
21 banks; No financial covenants
Manageable Maturity
3.3
2.3*
1.0
Due H2'20
Profile
BAT
A BETTER TOMORROW
£ in billions
7.2
3.0
Due'21
8.9yr
88:12
59:24:11:6
Repaid in July 2020
Due'22
2.6
Due'23
Average Maturity
Fixed:Floating
$:£:€:Other
45View entire presentation