Karat IPO Presentation Deck
HISTORICAL CAPEX DETAIL
($ in millions)
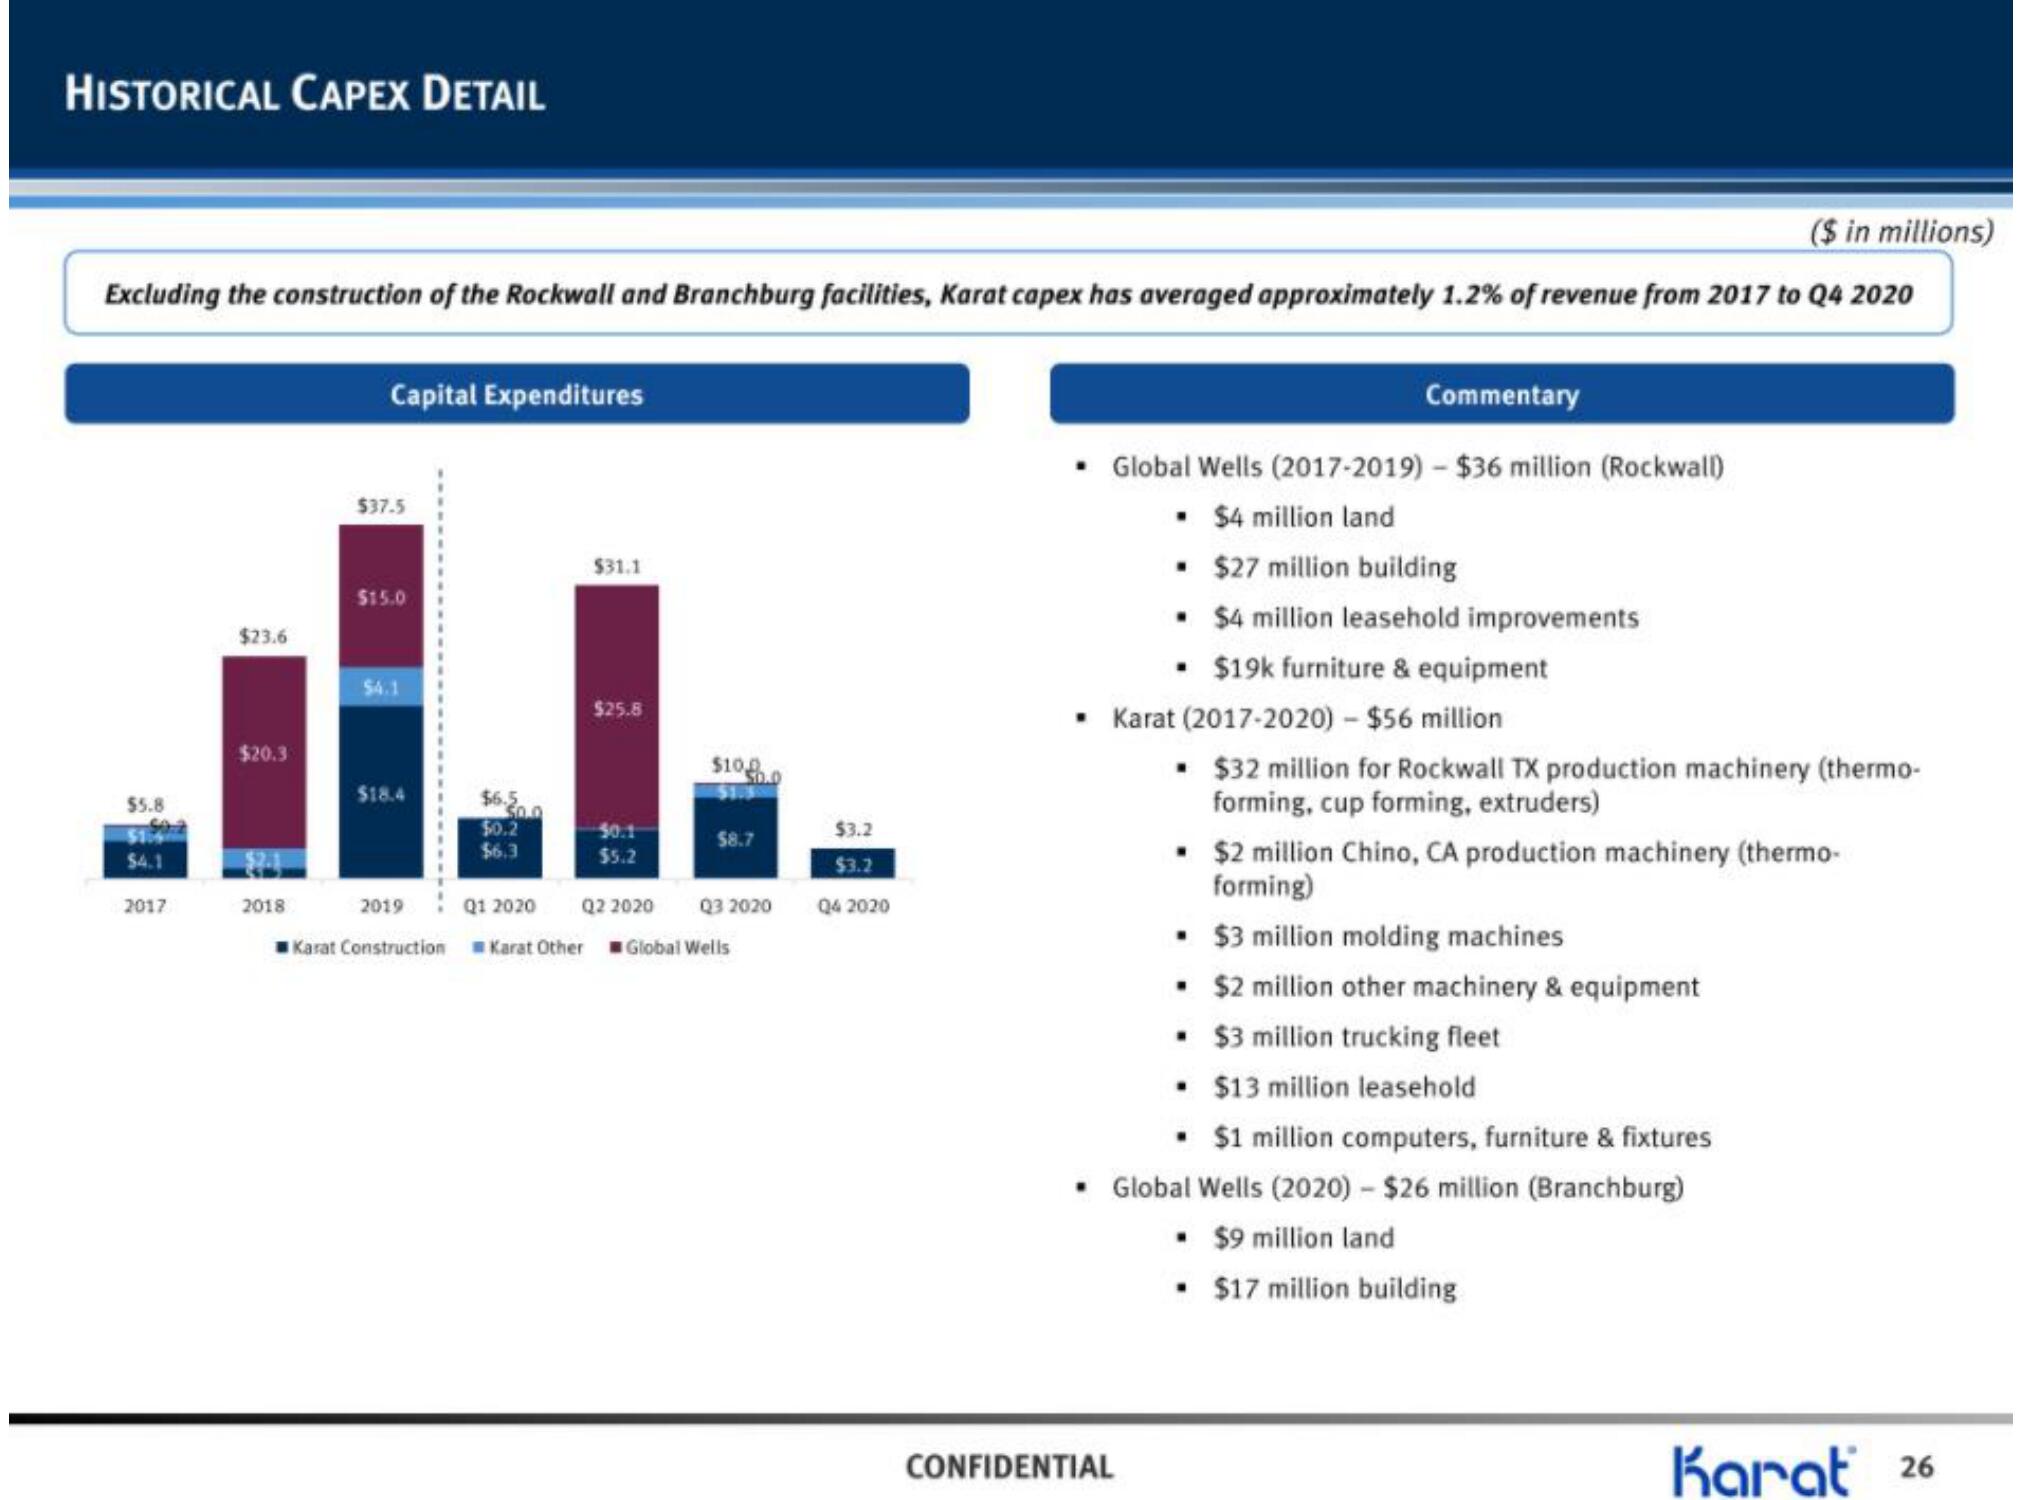
Excluding the construction of the Rockwall and Branchburg facilities, Karat capex has averaged approximately 1.2% of revenue from 2017 to Q4 2020
$5.8
$4.1
2017
$23.6
$20.3
2018
Capital Expenditures
$37.5
$15.0
$4.1
$18.4
2019
Karat Construction
$6.5
$0.2
$6.3
$31.1
Q1 2020
$25.8
$10,0
$113
$5.2
Q2 2020
Karat Other Global Wells
50.0
$8.7
Q3 2020
$3.2
$3.2
Q4 2020
Commentary
• Global Wells (2017-2019) - $36 million (Rockwall)
▪ $4 million land
. $27 million building
• $4 million leasehold improvements
• $19k furniture & equipment
Karat (2017-2020) - $56 million
. $32 million for Rockwall TX production machinery (thermo-
forming, cup forming, extruders)
CONFIDENTIAL
• $2 million Chino, CA production machinery (thermo-
forming)
• $3 million molding machines
• $2 million other machinery & equipment
. $3 million trucking fleet
. $13 million leasehold
. $1 million computers, furniture & fixtures
• Global Wells (2020)- $26 million (Branchburg)
. $9 million land
. $17 million building
Karat 26View entire presentation