Kin SPAC Presentation Deck
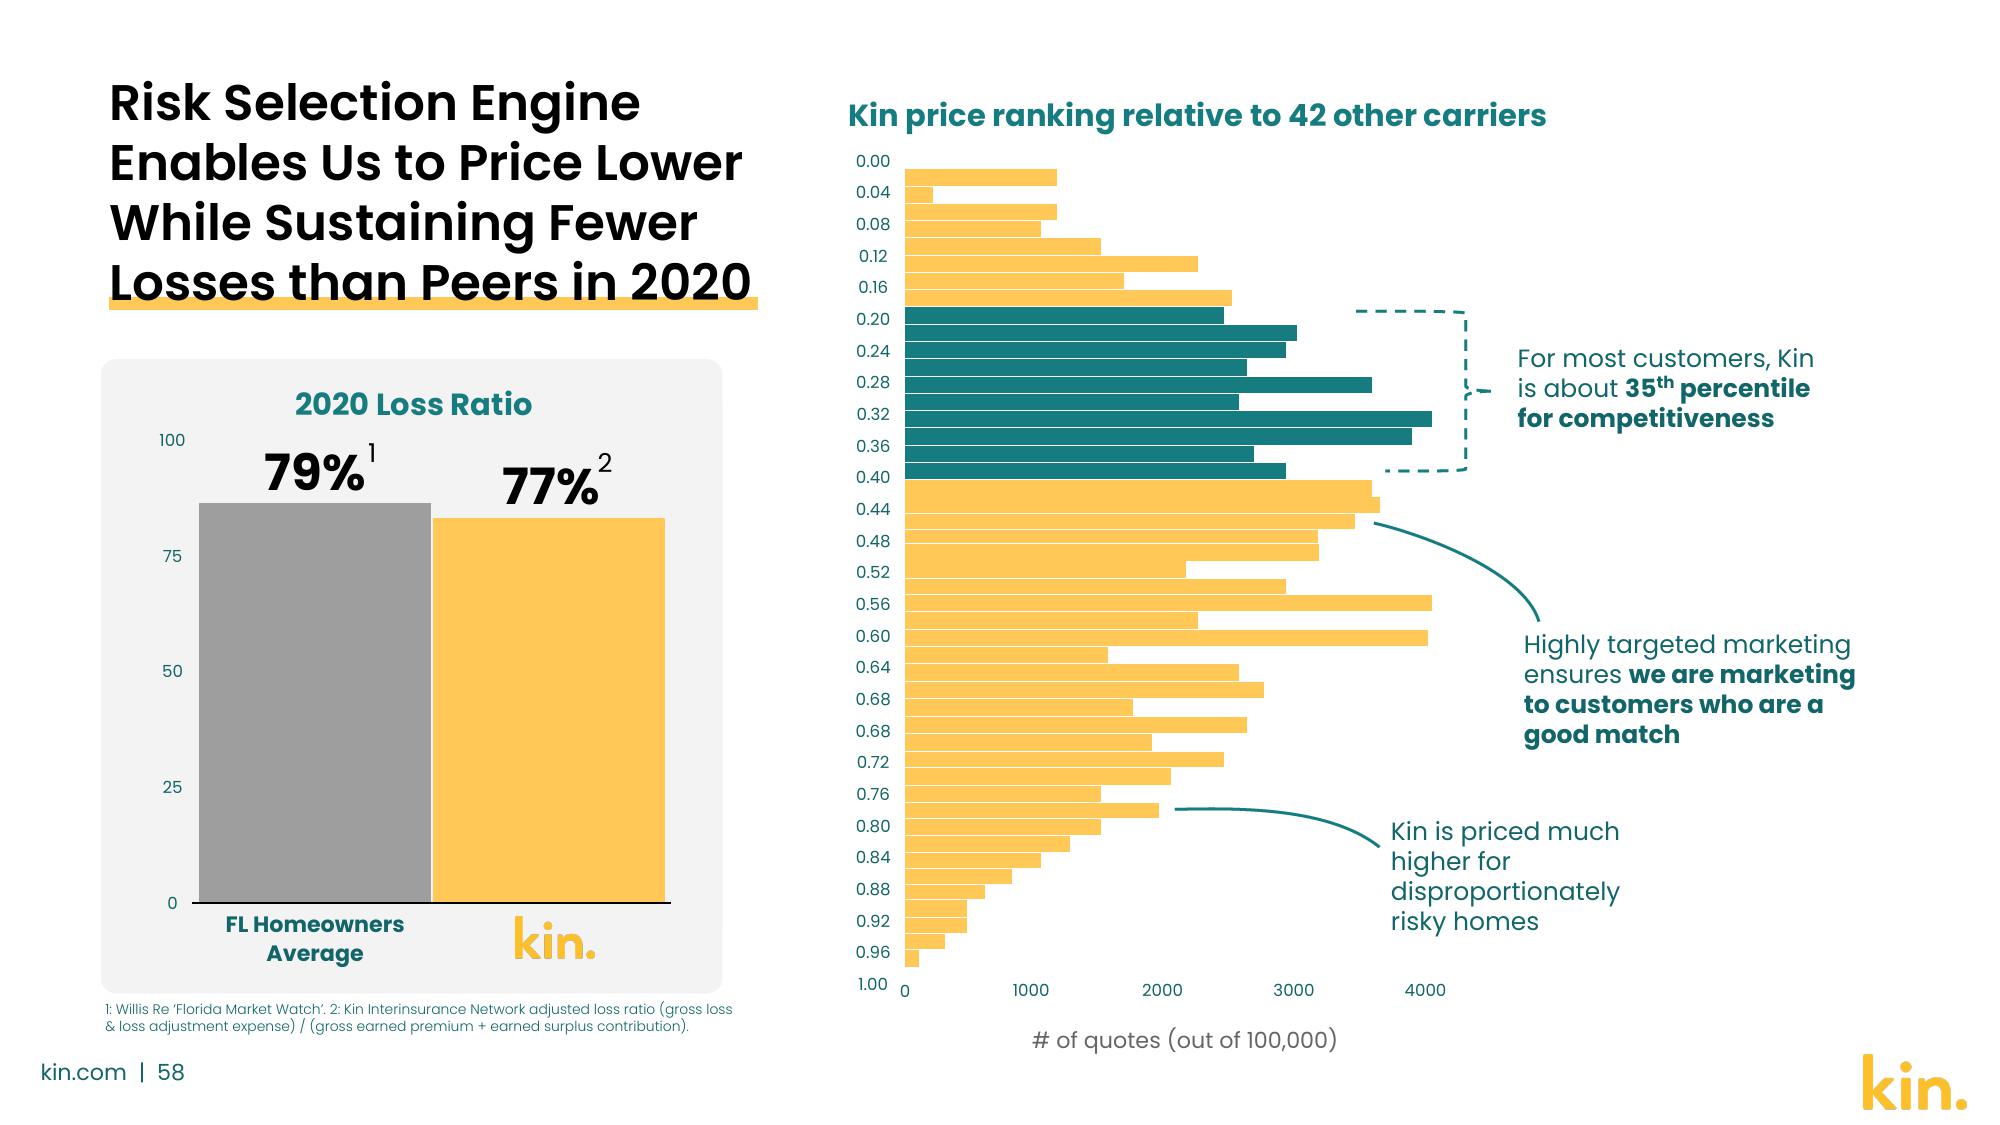
Risk Selection Engine
Enables Us to Price Lower
While Sustaining Fewer
Losses than Peers in 2020
100
75
50
25
0
2020 Loss Ratio
kin.com | 58
1
79%
kin.
1: Willis Re 'Florida Market Watch'. 2: Kin Interinsurance Network adjusted loss ratio (gross loss
& loss adjustment expense) / (gross earned premium + earned surplus contribution).
2
77%²
FL Homeowners
Average
Kin price ranking relative to 42 other carriers
0.00
0.04
0.08
0.12
0.16
0.20
0.24
0.28
0.32
0.36
0.40
0.44
0.48
0.52
0.56
0.60
0.64
0.68
0.68
0.72
0.76
0.80
0.84
0.88
0.92
0.96
1.00 O
1000
2000
3000
# of quotes (out of 100,000)
For most customers, Kin
is about 35th percentile
for competitiveness
4000
Highly targeted marketing
ensures we are marketing
to customers who are a
good match
Kin is priced much
higher for
disproportionately
risky homes
kin.View entire presentation