First Merchants Results Presentation Deck
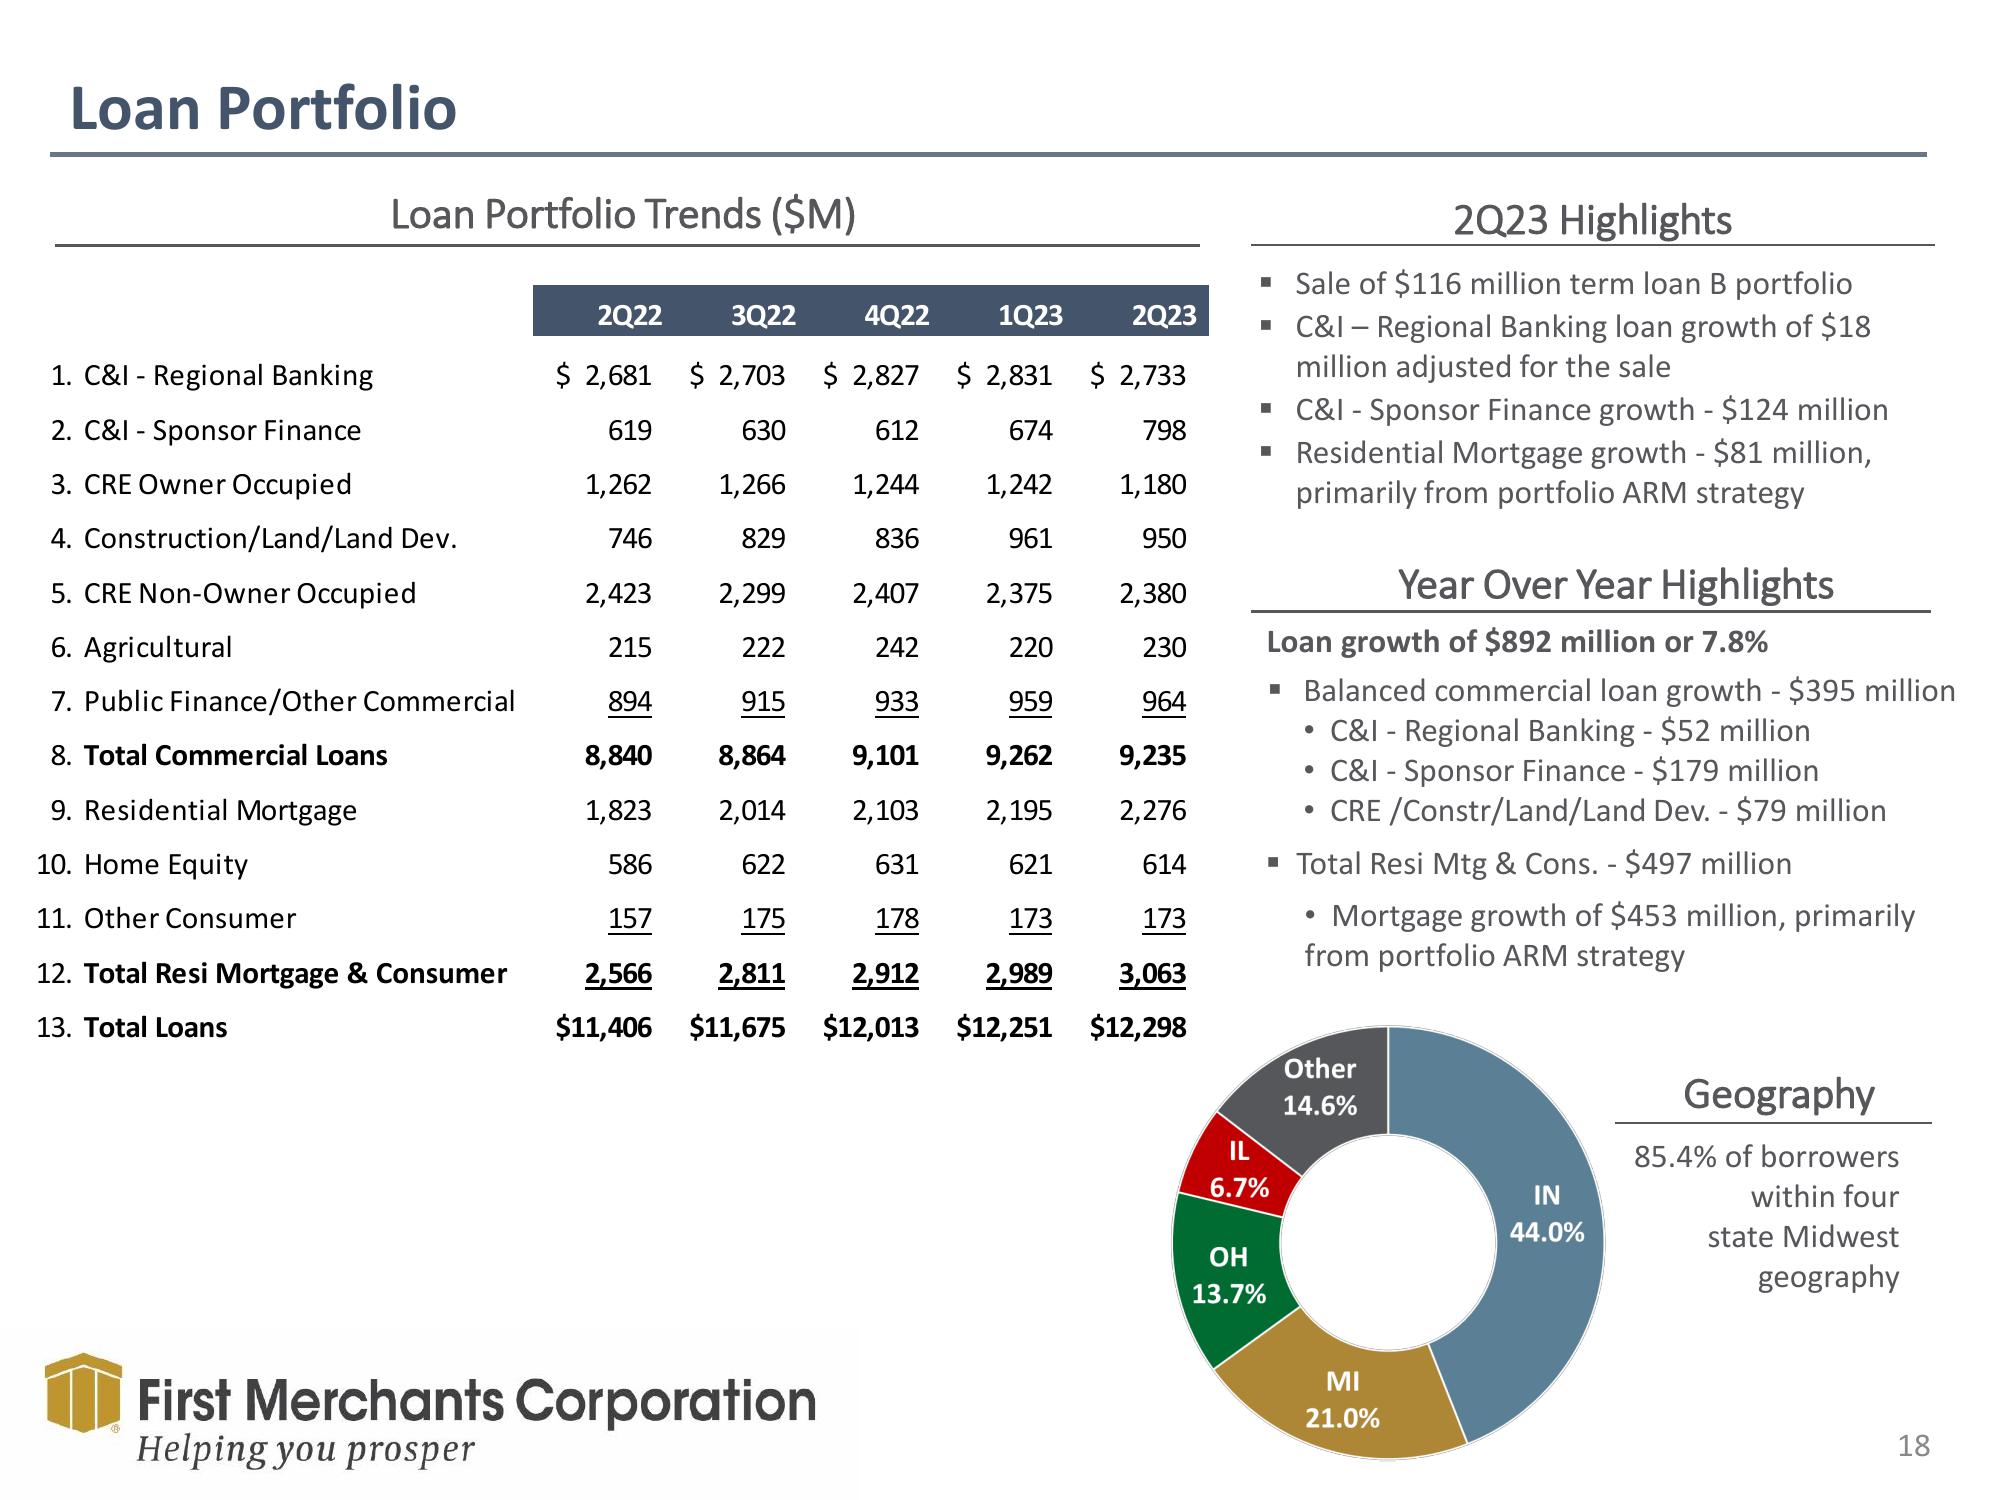
Loan Portfolio
1. C&I - Regional Banking
2. C&I - Sponsor Finance
3. CRE Owner Occupied
Loan Portfolio Trends ($M)
4. Construction/Land/Land Dev.
5. CRE Non-Owner Occupied
6. Agricultural
7. Public Finance/Other Commercial
8. Total Commercial Loans
9. Residential Mortgage
10. Home Equity
11. Other Consumer
12. Total Resi Mortgage & Consumer
13. Total Loans
2Q22
3Q22
4Q22
1Q23
2Q23
$ 2,681 $ 2,703 $ 2,827 $ 2,831 $ 2,733
619
630
612
674
798
1,180
1,262
1,266
1,244
1,242
961
746
829
836
950
2,423
2,299 2,407 2,375
2,380
215
222
242
220
230
894
915
933
959
964
8,840
8,864
9,101
9,262
9,235
1,823 2,014
2,103
2,195 2,276
586
622
631
621
614
157
175
178
173
173
2,566 2,811 2,912 2,989 3,063
$11,406 $11,675 $12,013 $12,251 $12,298
First Merchants Corporation
Helping you prosper
2023 Highlights
▪ Sale of $116 million term loan B portfolio
C&I - Regional Banking loan growth of $18
million adjusted for the sale
▪ C&I - Sponsor Finance growth - $124 million
▪ Residential Mortgage growth - $81 million,
primarily from portfolio ARM strategy
■
OH
13.7%
Loan growth of $892 million or 7.8%
▪ Balanced commercial loan growth - $395 million
C&I- Regional Banking - $52 million
C&I - Sponsor Finance - $179 million
• CRE/Constr/Land/Land Dev. - $79 million
IL
6.7%
●
●
▪ Total Resi Mtg & Cons. - $497 million
Mortgage growth of $453 million, primarily
from portfolio ARM strategy
●
Year Over Year Highlights
Other
14.6%
MI
21.0%
IN
44.0%
Geography
85.4% of borrowers
within four
state Midwest
geography
18View entire presentation