Q4 2020 Investor Presentation
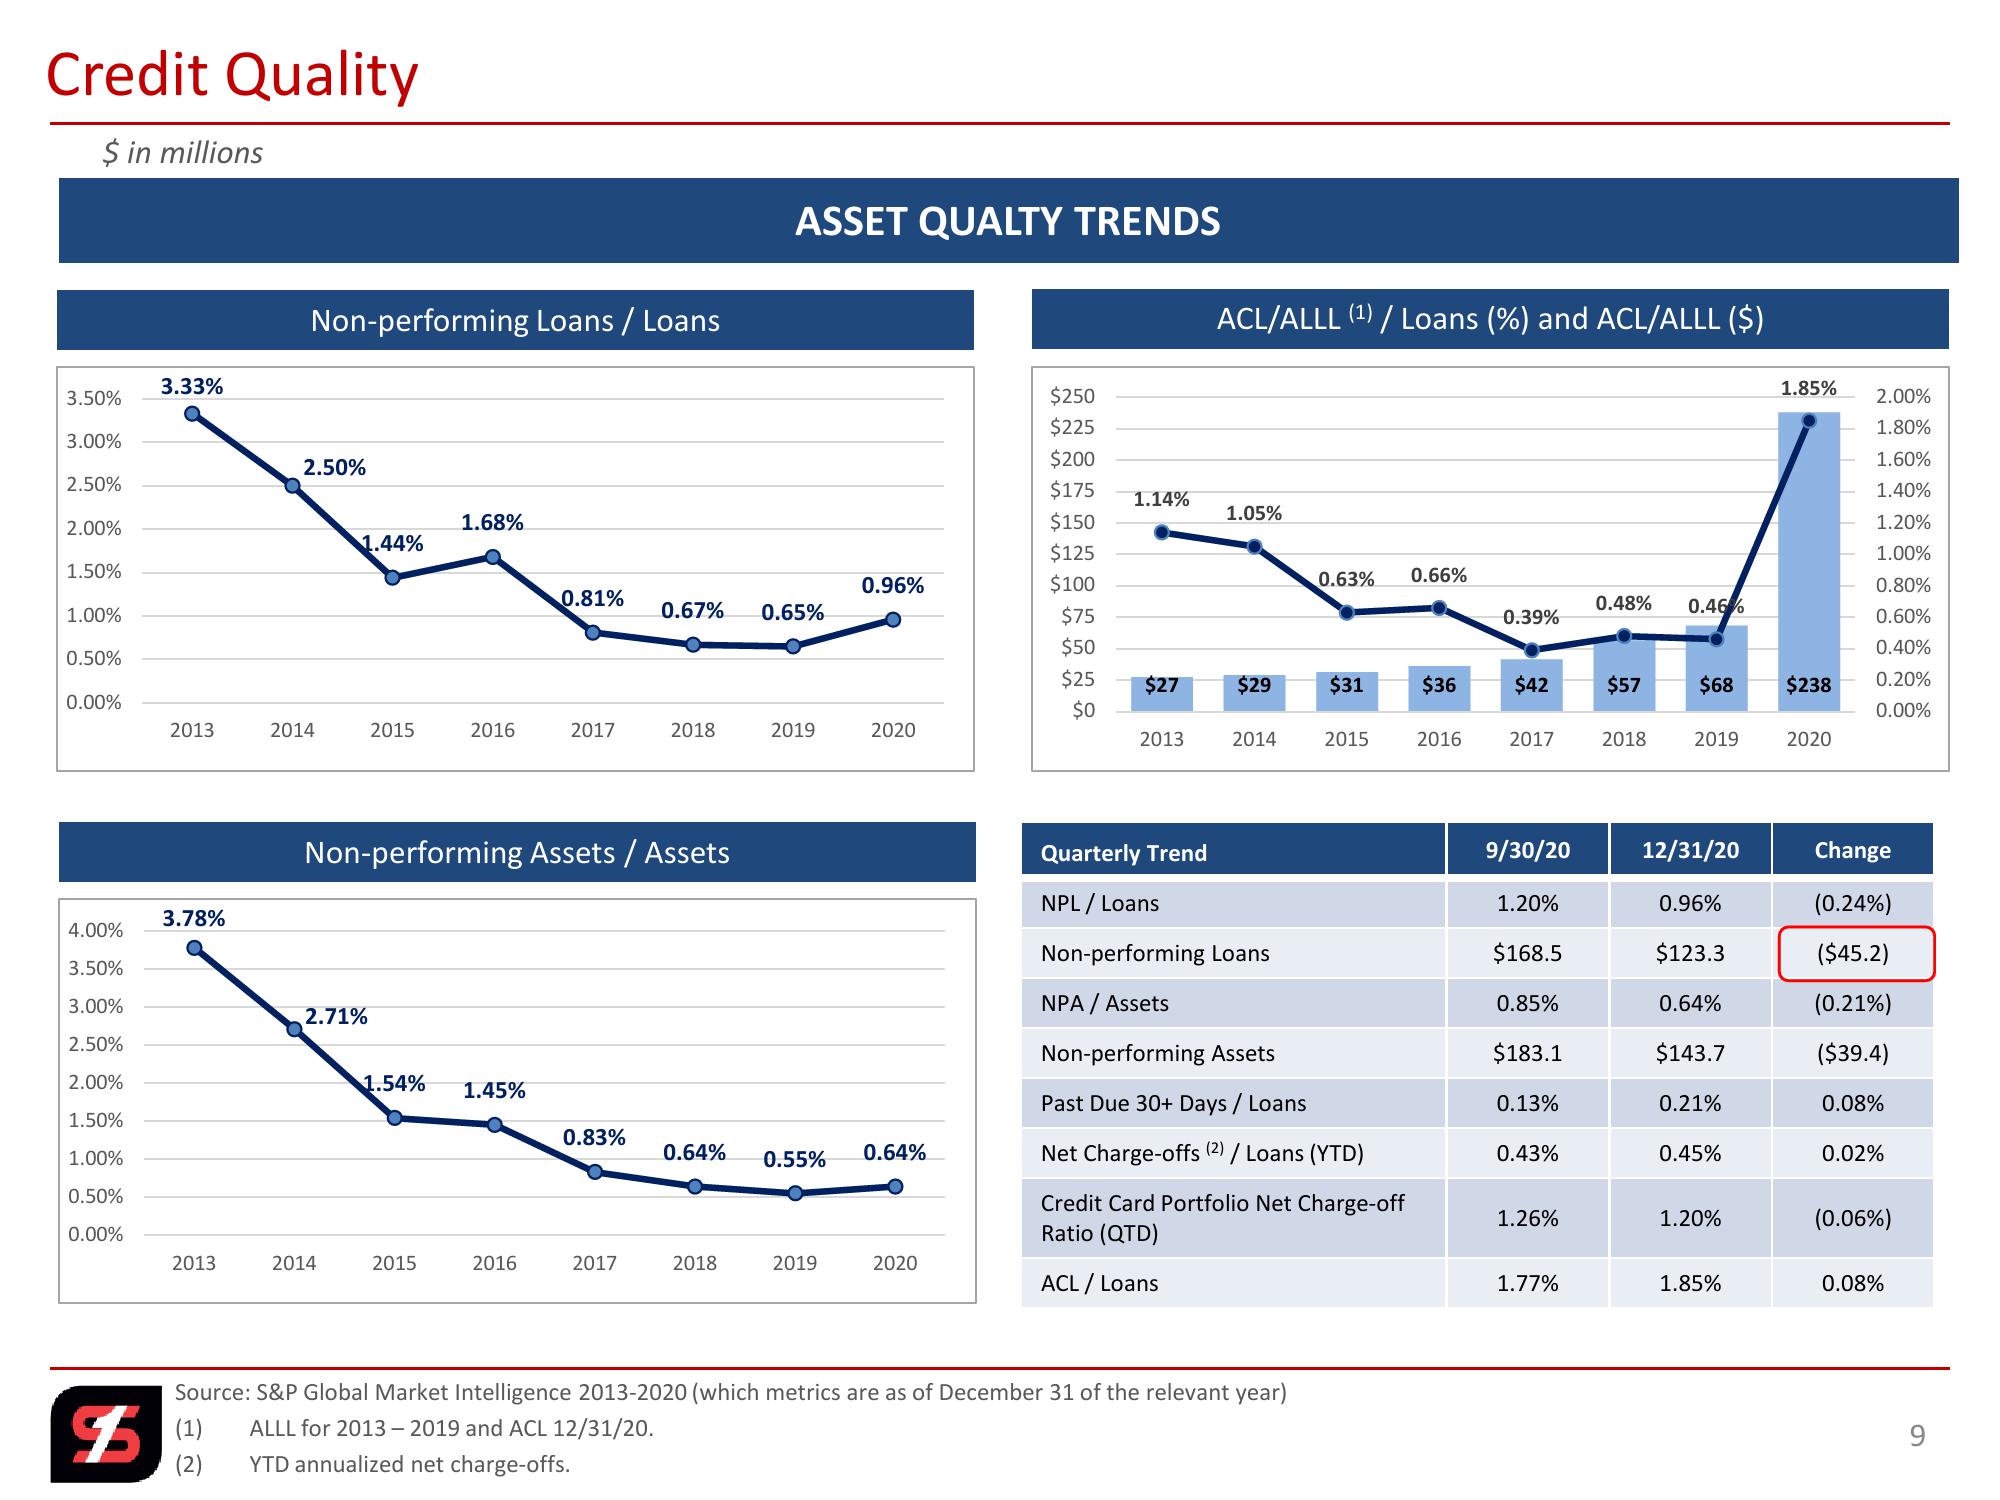
Credit Quality
$ in millions
Non-performing Loans / Loans
ASSET QUALTY TRENDS
ACL/ALLL (1) / Loans (%) and ACL/ALLL ($)
3.33%
1.85%
3.50%
$250
2.00%
$225
1.80%
3.00%
$200
1.60%
2.50%
2.50%
$175
1.14%
1.40%
2.00%
1.68%
1.44%
$150
1.05%
1.20%
$125
1.00%
1.50%
0.96%
$100
0.81%
1.00%
0.67%
0.65%
$75
0.63%
0.66%
0.48%
0.46%
0.39%
0.80%
0.60%
$50
0.40%
0.50%
$25
$27
$29
$31
$36
$42
$57
$68
$238
0.20%
0.00%
$0
0.00%
2013
2014
2015
2016
2017
2018
2019
2020
2013
2014
2015
2016
2017
2018
2019
2020
Non-performing Assets / Assets
Quarterly Trend
9/30/20
12/31/20
Change
NPL / Loans
1.20%
0.96%
3.78%
(0.24%)
4.00%
3.50%
Non-performing Loans
$168.5
$123.3
($45.2)
3.00%
NPA/Assets
0.85%
0.64%
2.50%
2.00%
2.71%
1.54% 1.45%
(0.21%)
Non-performing Assets
$183.1
$143.7
($39.4)
Past Due 30+ Days / Loans
0.13%
0.21%
0.08%
1.50%
0.83%
1.00%
0.64% 0.55% 0.64%
Net Charge-offs (2) / Loans (YTD)
0.43%
0.45%
0.02%
0.50%
0.00%
Credit Card Portfolio Net Charge-off
Ratio (QTD)
1.26%
1.20%
(0.06%)
2013
2014
2015
2016
2017
2018
2019
2020
ACL / Loans
1.77%
1.85%
0.08%
Source: S&P Global Market Intelligence 2013-2020 (which metrics are as of December 31 of the relevant year)
ALLL for 2013 - 2019 and ACL 12/31/20.
$
(1)
(2)
YTD annualized net charge-offs.
9View entire presentation