SmileDirectClub Investor Presentation Deck
Balance sheet highlights.
●
●
●
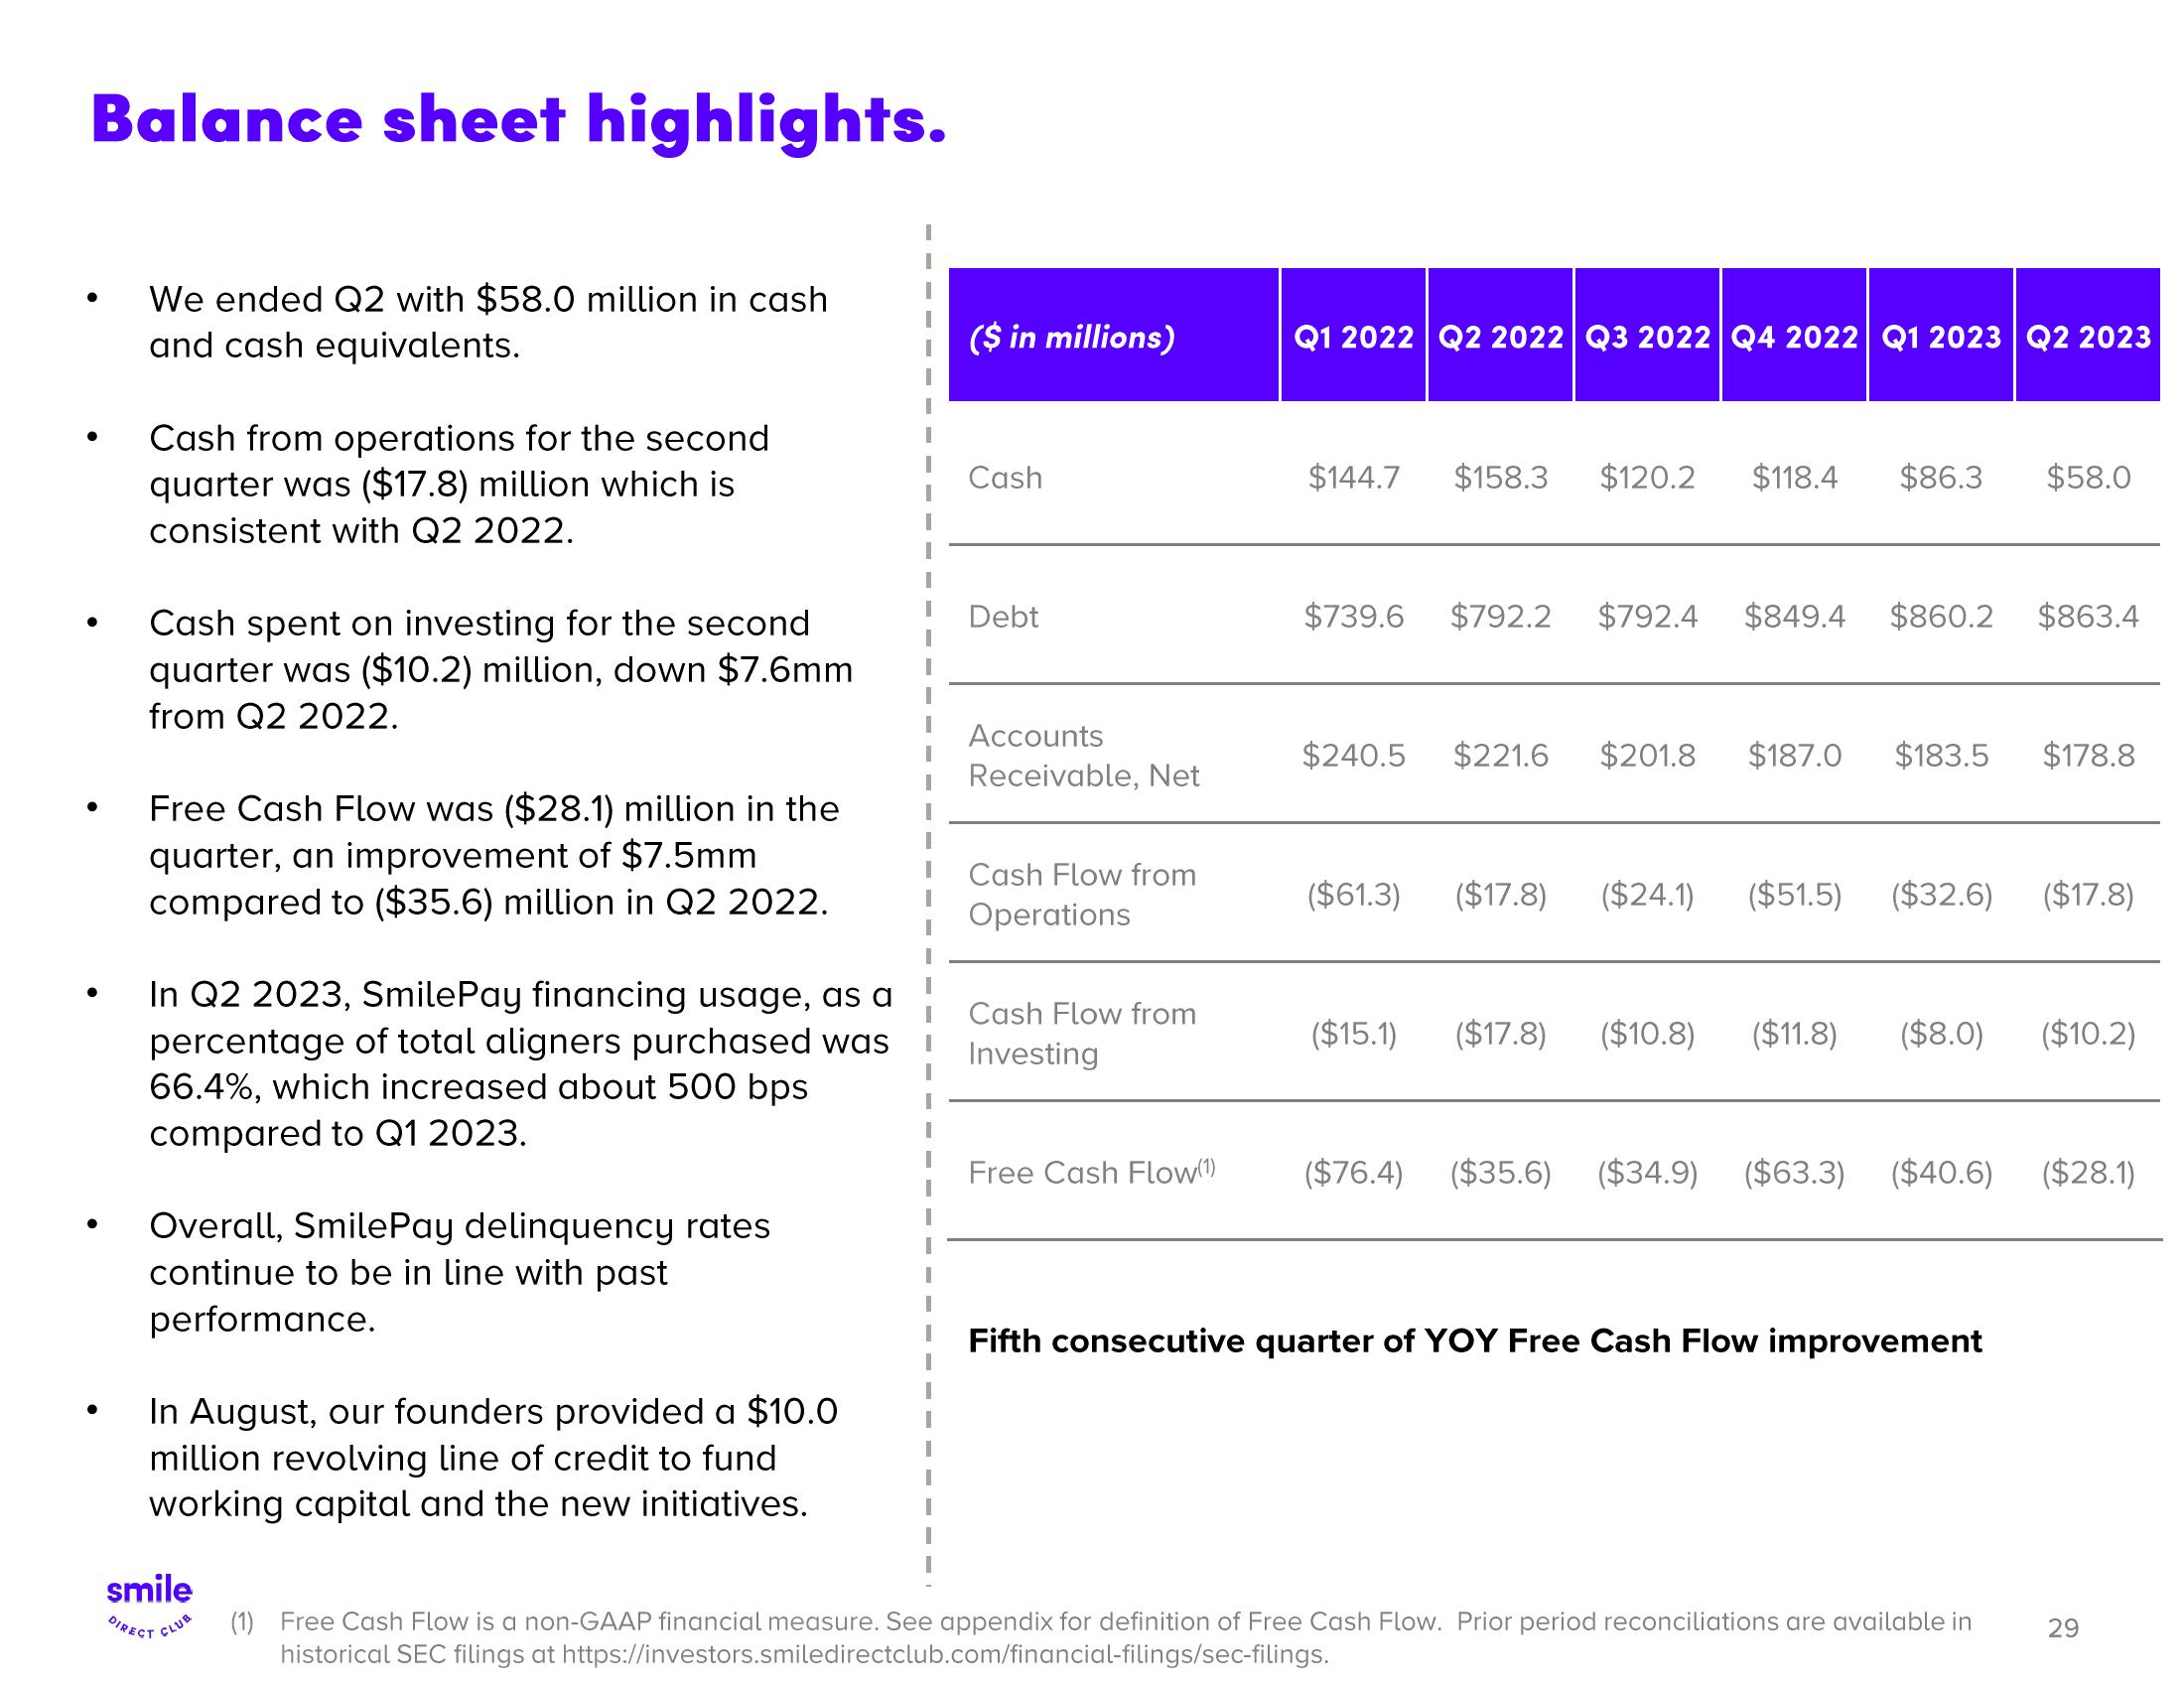
We ended Q2 with $58.0 million in cash
and cash equivalents.
Cash from operations for the second
quarter was ($17.8) million which is
consistent with Q2 2022.
Cash spent on investing for the second
quarter was ($10.2) million, down $7.6mm
from Q2 2022.
Free Cash Flow was ($28.1) million in the
quarter, an improvement of $7.5mm
compared to ($35.6) million in Q2 2022.
In Q2 2023, SmilePay financing usage, as a
percentage of total aligners purchased was
66.4%, which increased about 500 bps
compared to Q1 2023.
Overall, SmilePay delinquency rates
continue to be in line with past
performance.
In August, our founders provided a $10.0
million revolving line of credit to fund
working capital and the new initiatives.
smile
DIRECT CLUB
($ in millions)
Cash
Debt
Accounts
Receivable, Net
Cash Flow from
Operations
Cash Flow from
Investing
Free Cash Flow(¹)
Q1 2022 | Q2 2022 | Q3 2022 | Q4 2022 Q1 2023 | Q2 2023
$144.7 $158.3 $120.2 $118.4 $86.3 $58.0
$739.6 $792.2 $792.4 $849.4 $860.2
$240.5 $221.6 $201.8 $187.0 $183.5 $178.8
($61.3) ($17.8) ($24.1) ($51.5) ($32.6) ($17.8)
($15.1)
$863.4
($17.8) ($10.8) ($11.8) ($8.0) ($10.2)
($76.4) ($35.6) ($34.9) ($63.3) ($40.6) ($28.1)
Fifth consecutive quarter of YOY Free Cash Flow improvement
(1) Free Cash Flow is a non-GAAP financial measure. See appendix for definition of Free Cash Flow. Prior period reconciliations are available in
historical SEC filings at https://investors.smiledirectclub.com/financial-filings/sec-filings.
29View entire presentation