Synchrony Financial Results Presentation Deck
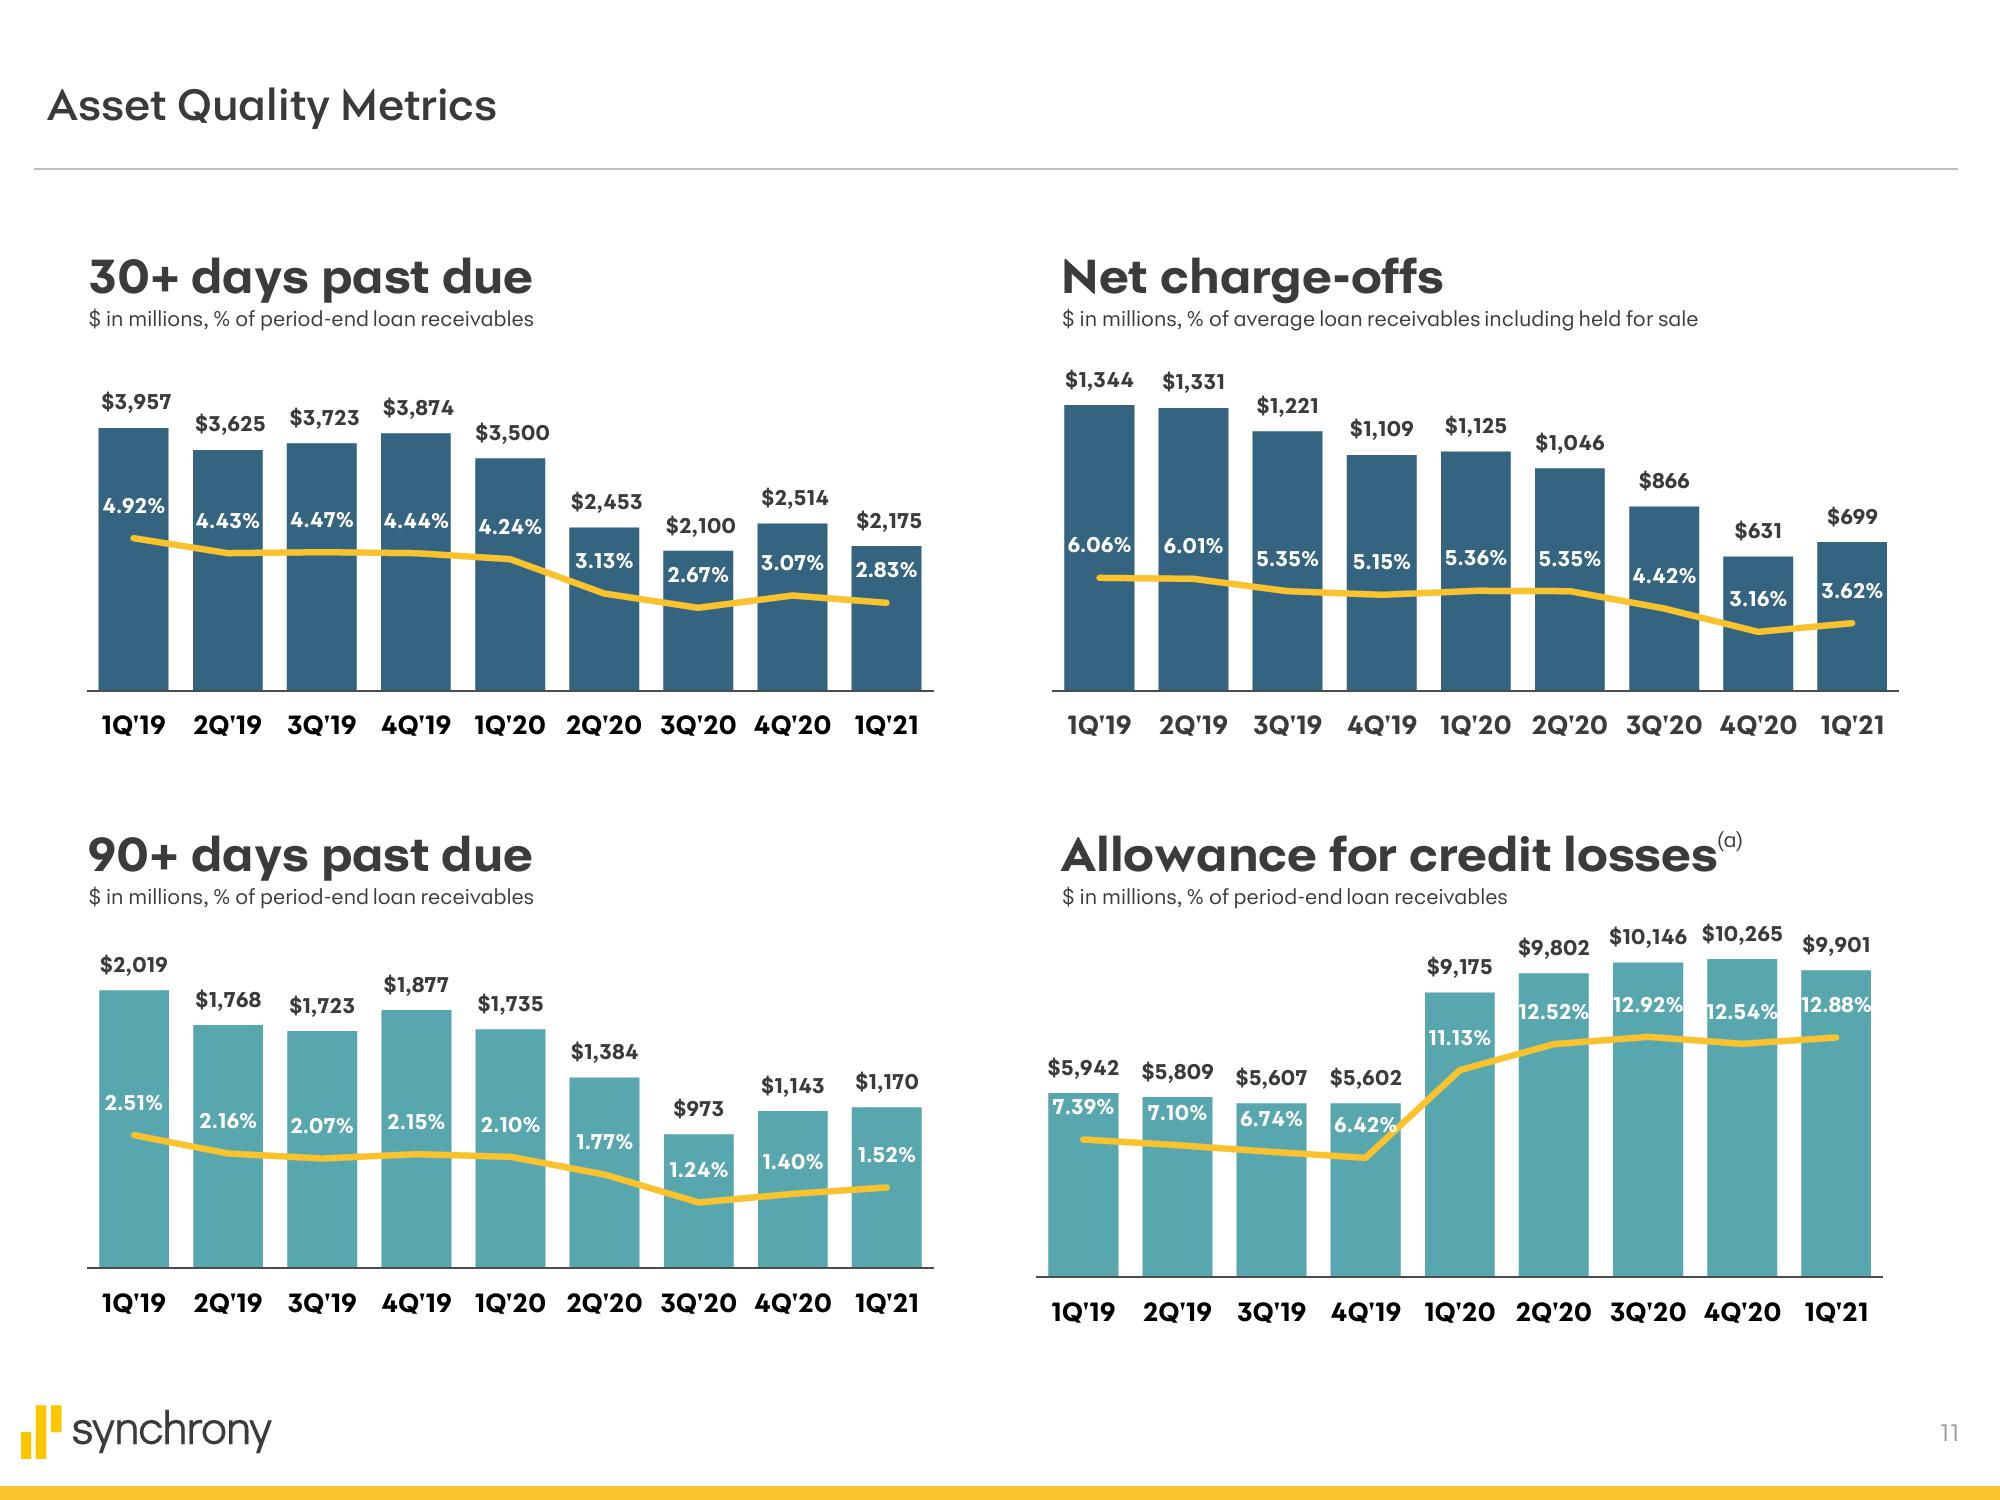
Asset Quality Metrics
30+ days past due
$ in millions, % of period-end loan receivables
$3,957
4.92%
$3,625 $3,723 $3,874
$2,019
2.51%
4.43% 4.47% 4.44% 4.24%
90+ days past due
$ in millions, % of period-end loan receivables
$3,500
$1,768 $1,723
$1,877
synchrony
1Q'19 2Q'19 3Q'19 4Q'19 1Q'20 2Q'20 3Q'20 4Q'20 1Q'21
$1,735
2.16% 2.07% 2.15% 2.10%
$2,453
3.13%
$1,384
$2,100
2.67%
1.77%
$973
$2,514
1.24%
3.07%
$2,175
2.83%
$1,143 $1,170
1.40% 1.52%
1Q'19 2Q'19 3Q'19 4Q'19 1Q'20 2Q'20 3Q'20 4Q'20 1Q'21
Net charge-offs
$ in millions, % of average loan receivables including held for sale
$1,344 $1,331
6.06% 6.01%
$1,221
$1,109 $1,125
5.35% 5.15% 5.36% 5.35%
$1,046
$5,942 $5,809 $5,607 $5,602
7.39% 7.10%
6.74% 6.42%
$9,175
Allowance for credit losses
$ in millions, % of period-end loan receivables
11.13%
$866
4.42%
1Q'19 2Q'19 3Q'19 4Q'19 1Q'20 2Q'20 3Q'20 4Q'20 1Q'21
$9,802
$631
$699
3.16% 3.62%
$10,146 $10,265
$9,901
12.52% 12.92% 12.54% 12.88%
1Q'19 2Q'19 3Q'19 4Q'19 1Q'20 2Q'20 3Q'20 4Q'20 1Q'21
11View entire presentation