dLocal Investor Day Presentation Deck
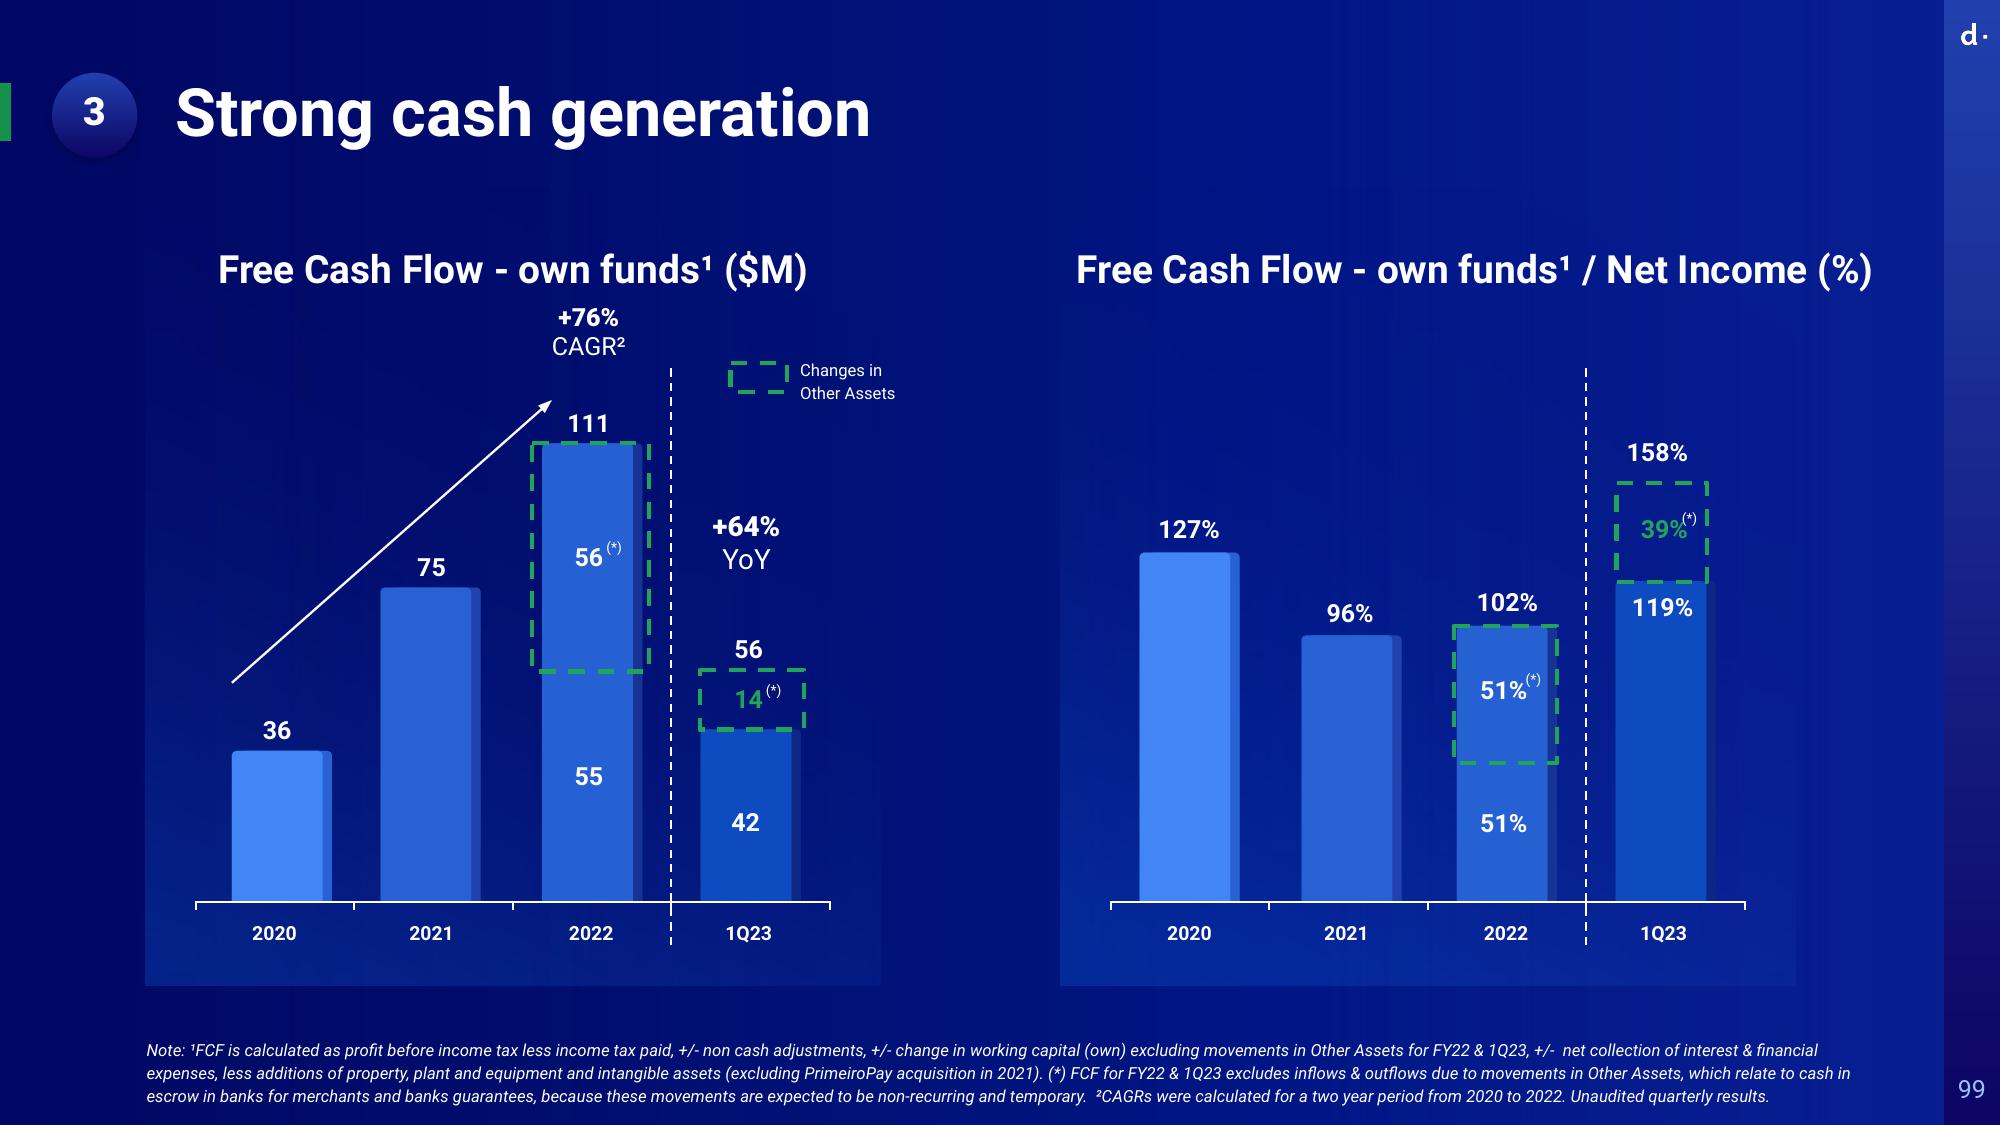
3 Strong cash generation
Free Cash Flow - own funds¹ ($M)
+76%
CAGR²
36
2020
75
2021
111
56
(*)
55
2022
|
+64%
YOY
56
14(*)
42
1Q23
Changes in
Other Assets
Free Cash Flow - own funds¹ / Net Income (%)
127%
2020
96%
2021
102%
51%(*)
51%
2022
I
1
158%
39% (*)
119%
1Q23
Note: ¹FCF is calculated as profit before income tax less income tax paid, +/- non cash adjustments, +/- change in working capital (own) excluding movements in Other Assets for FY22 & 1023, +/- net collection of interest & financial
expenses, less additions of property, plant and equipment and intangible assets (excluding PrimeiroPay acquisition in 2021). (*) FCF for FY22 & 1023 excludes inflows & outflows due to movements in Other Assets, which relate to cash in
escrow in banks for merchants and banks guarantees, because these movements are expected to be non-recurring and temporary. 2CAGRS were calculated for a two year period from 2020 to 2022. Unaudited quarterly results.
d.
99View entire presentation