Hertz Investor Presentation Deck
TRAVEL INDUSTRY SHOWING
SIGNS OF RECOVERY
.
Commentary
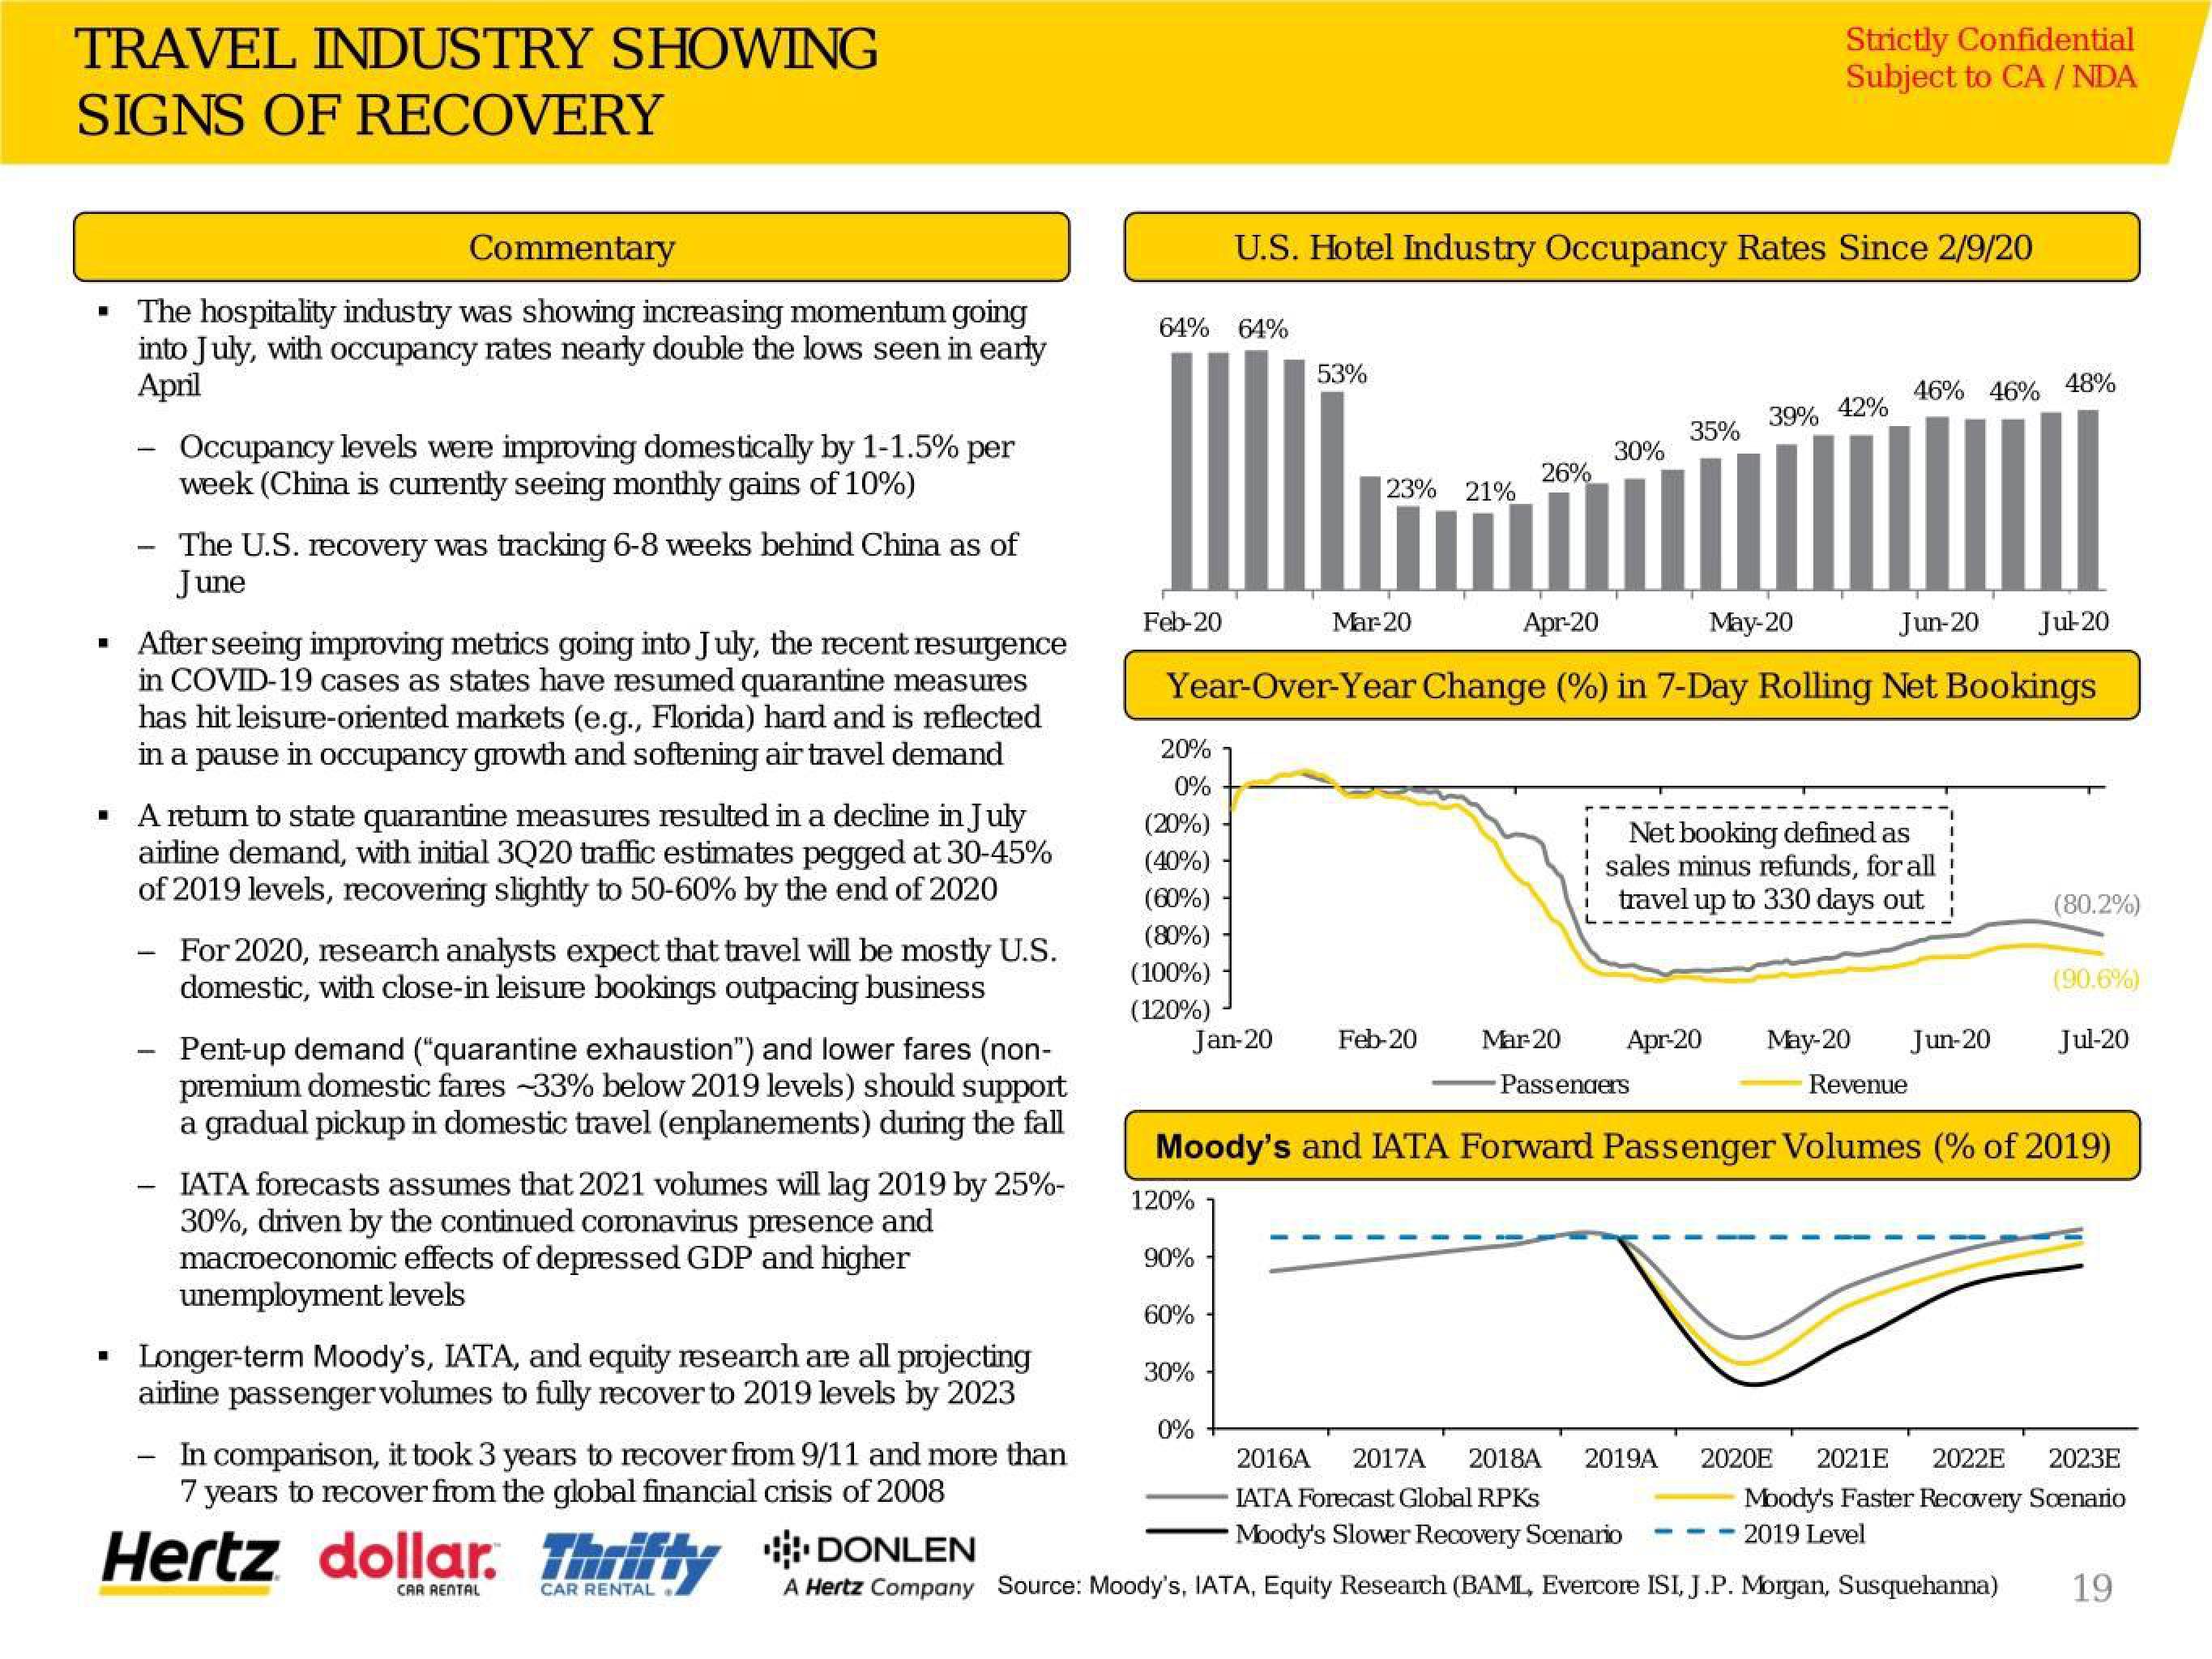
The hospitality industry was showing increasing momentum going
into July, with occupancy rates nearly double the lows seen in early
April
-
-
▪ After seeing improving metrics going into July, the recent resurgence
in COVID-19 cases as states have resumed quarantine measures
has hit leisure-oriented markets (e.g., Florida) hard and is reflected
in a pause in occupancy growth and softening air travel demand
-
Occupancy levels were improving domestically by 1-1.5% per
week (China is currently seeing monthly gains of 10%)
▪ A retum to state quarantine measures resulted in a decline in July
airline demand, with initial 3Q20 traffic estimates pegged at 30-45%
of 2019 levels, recovering slightly to 50-60% by the end of 2020
-
The U.S. recovery was tracking 6-8 weeks behind China as of
June
-
For 2020, research analysts expect that travel will be mostly U.S.
domestic, with close-in leisure bookings outpacing business
Pent-up demand ("quarantine exhaustion") and lower fares (non-
premium domestic fares -33% below 2019 levels) should support
a gradual pickup in domestic travel (enplanements) during the fall
IATA forecasts assumes that 2021 volumes will lag 2019 by 25%-
30%, driven by the continued coronavirus presence and
macroeconomic effects of depressed GDP and higher
unemployment levels
Longer-term Moody's, IATA, and equity research are all projecting
airline passenger volumes to fully recover to 2019 levels by 2023
In comparison, it took 3 years to recover from 9/11 and more than
7 years to recover from the global financial crisis of 2008
Hertz dollar. Thrifty DONLEN
CAR RENTAL
CAR RENTAL
64% 64%
Feb-20
20%
0%
(20%)
(40%)
(60%)
(80%)
(100%)
(120%)
Jan-20
120%
90%
U.S. Hotel Industry Occupancy Rates Since 2/9/20
60%
30%
53%
0%
23% 21%
Mar-20
Apr-20
Jun-20 Jul-20
Year-Over-Year Change (%) in 7-Day Rolling Net Bookings
26%
Feb-20
30%
Mar-20
35%
Strictly Confidential
Subject to CA/ NDA
May-20
Passengers
39% 42%
Net booking defined as
sales minus refunds, for all
travel up to 330 days out
46% 46% 48%
Apr-20 May-20 Jun-20
Moody's and IATA Forward Passenger Volumes (% of 2019)
——-
Revenue
(80.2%)
(90.6%)
Jul-20
2016A 2017A 2018A 2019A 2020E 2021E 2022E 2023E
IATA Forecast Global RPKs
Moody's Faster Recovery Scenario
2019 Level
Moody's Slower Recovery Scenario
A Hertz Company Source: Moody's, IATA, Equity Research (BAML, Evercore ISI, J.P. Morgan, Susquehanna) 19View entire presentation