Spring 2023 Solar Industry Update
PV Annual Installations (GWdc)
500
400
300
200
100
Change in Recent Global PV
Demand Projections
4
+81 GW
3
+34 GW
2
+42 GW
1
261 GW
in 2025
0
2020
2021
12022 2023④
2024
2025
2026
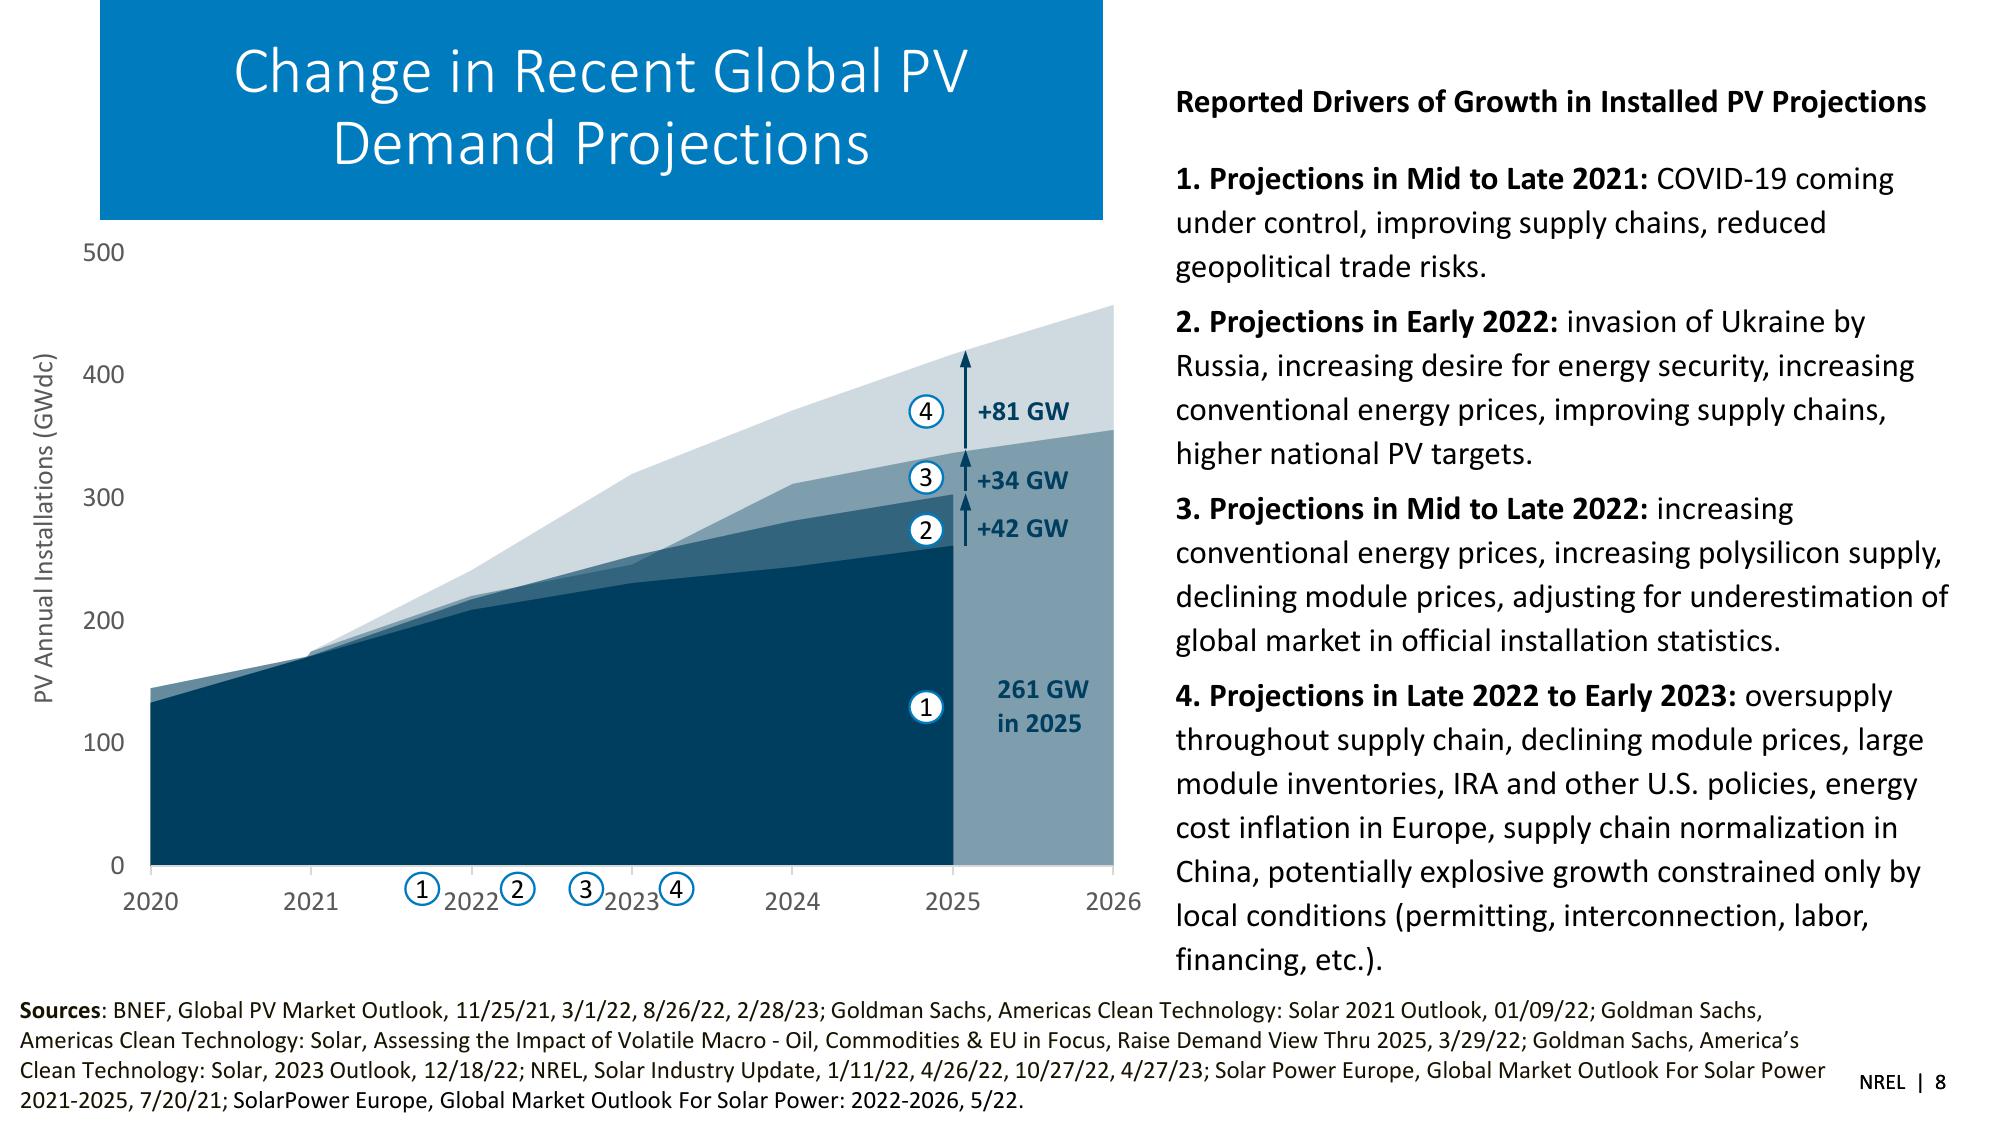
Reported Drivers of Growth in Installed PV Projections
1. Projections in Mid to Late 2021: COVID-19 coming
under control, improving supply chains, reduced
geopolitical trade risks.
2. Projections in Early 2022: invasion of Ukraine by
Russia, increasing desire for energy security, increasing
conventional energy prices, improving supply chains,
higher national PV targets.
3. Projections in Mid to Late 2022: increasing
conventional energy prices, increasing polysilicon supply,
declining module prices, adjusting for underestimation of
global market in official installation statistics.
4. Projections in Late 2022 to Early 2023: oversupply
throughout supply chain, declining module prices, large
module inventories, IRA and other U.S. policies, energy
cost inflation in Europe, supply chain normalization in
China, potentially explosive growth constrained only by
local conditions (permitting, interconnection, labor,
financing, etc.).
Sources: BNEF, Global PV Market Outlook, 11/25/21, 3/1/22, 8/26/22, 2/28/23; Goldman Sachs, Americas Clean Technology: Solar 2021 Outlook, 01/09/22; Goldman Sachs,
Americas Clean Technology: Solar, Assessing the Impact of Volatile Macro - Oil, Commodities & EU in Focus, Raise Demand View Thru 2025, 3/29/22; Goldman Sachs, America's
Clean Technology: Solar, 2023 Outlook, 12/18/22; NREL, Solar Industry Update, 1/11/22, 4/26/22, 10/27/22, 4/27/23; Solar Power Europe, Global Market Outlook For Solar Power
2021-2025, 7/20/21; Solar Power Europe, Global Market Outlook For Solar Power: 2022-2026, 5/22.
NREL | 8View entire presentation