Deutsche Bank Results Presentation Deck
Asset Management
In € m, unless stated otherwise
Financial results
Statement of income
Revenues
Revenues ex-specific items¹
Noninterest expenses
Adjusted costs
Noncontrolling interests
Profit (loss) before tax
Balance sheet and resources
Assets under management, in € bn²
Net flows, in € bn
Leverage exposure, in € bn
Risk-weighted assets, in € bn
Performance measures and ratios.
Management fee margin, in bps
Cost/income ratio
ROTE³
Q1 2023
Note: for footnotes refer to slides 45 and 46
Deutsche Bank
Investor Relations
589 (14)%
589
(14)%
436
3%
426
39
115
841
6
9
13.
A vs.
A vs.
Q1 2022 Q4 2022
27.7
1%
(28)%
(44)%
(7)%
n.m.
(7)%
(5)%
(3)%
(3)%
(11)%
9%
33%
28%
2%
n.m.
(4)%
0%
0.1bps (0.4)bps
74% 12ppt (7)ppt
13.6% (11.9)ppt 4.0ppt
Q1 2023 results
April 27, 2023
Revenue and AuM performance
Revenues
fees
Perf. &
trans. Mgmt.
Other fees
AM
11
AuM, in € bn²
821
80
118
199
424
Q4 2022
Cash
841
77
113
213
438
Q1 2023
Alternatives
571
589
A vs. Q1
2022
(8)%
Passive
(58)%
(80)%
(14)%
Net flows, in € bn
6
4
6
Q1 2023
Active ex-Cash
Key highlights
/
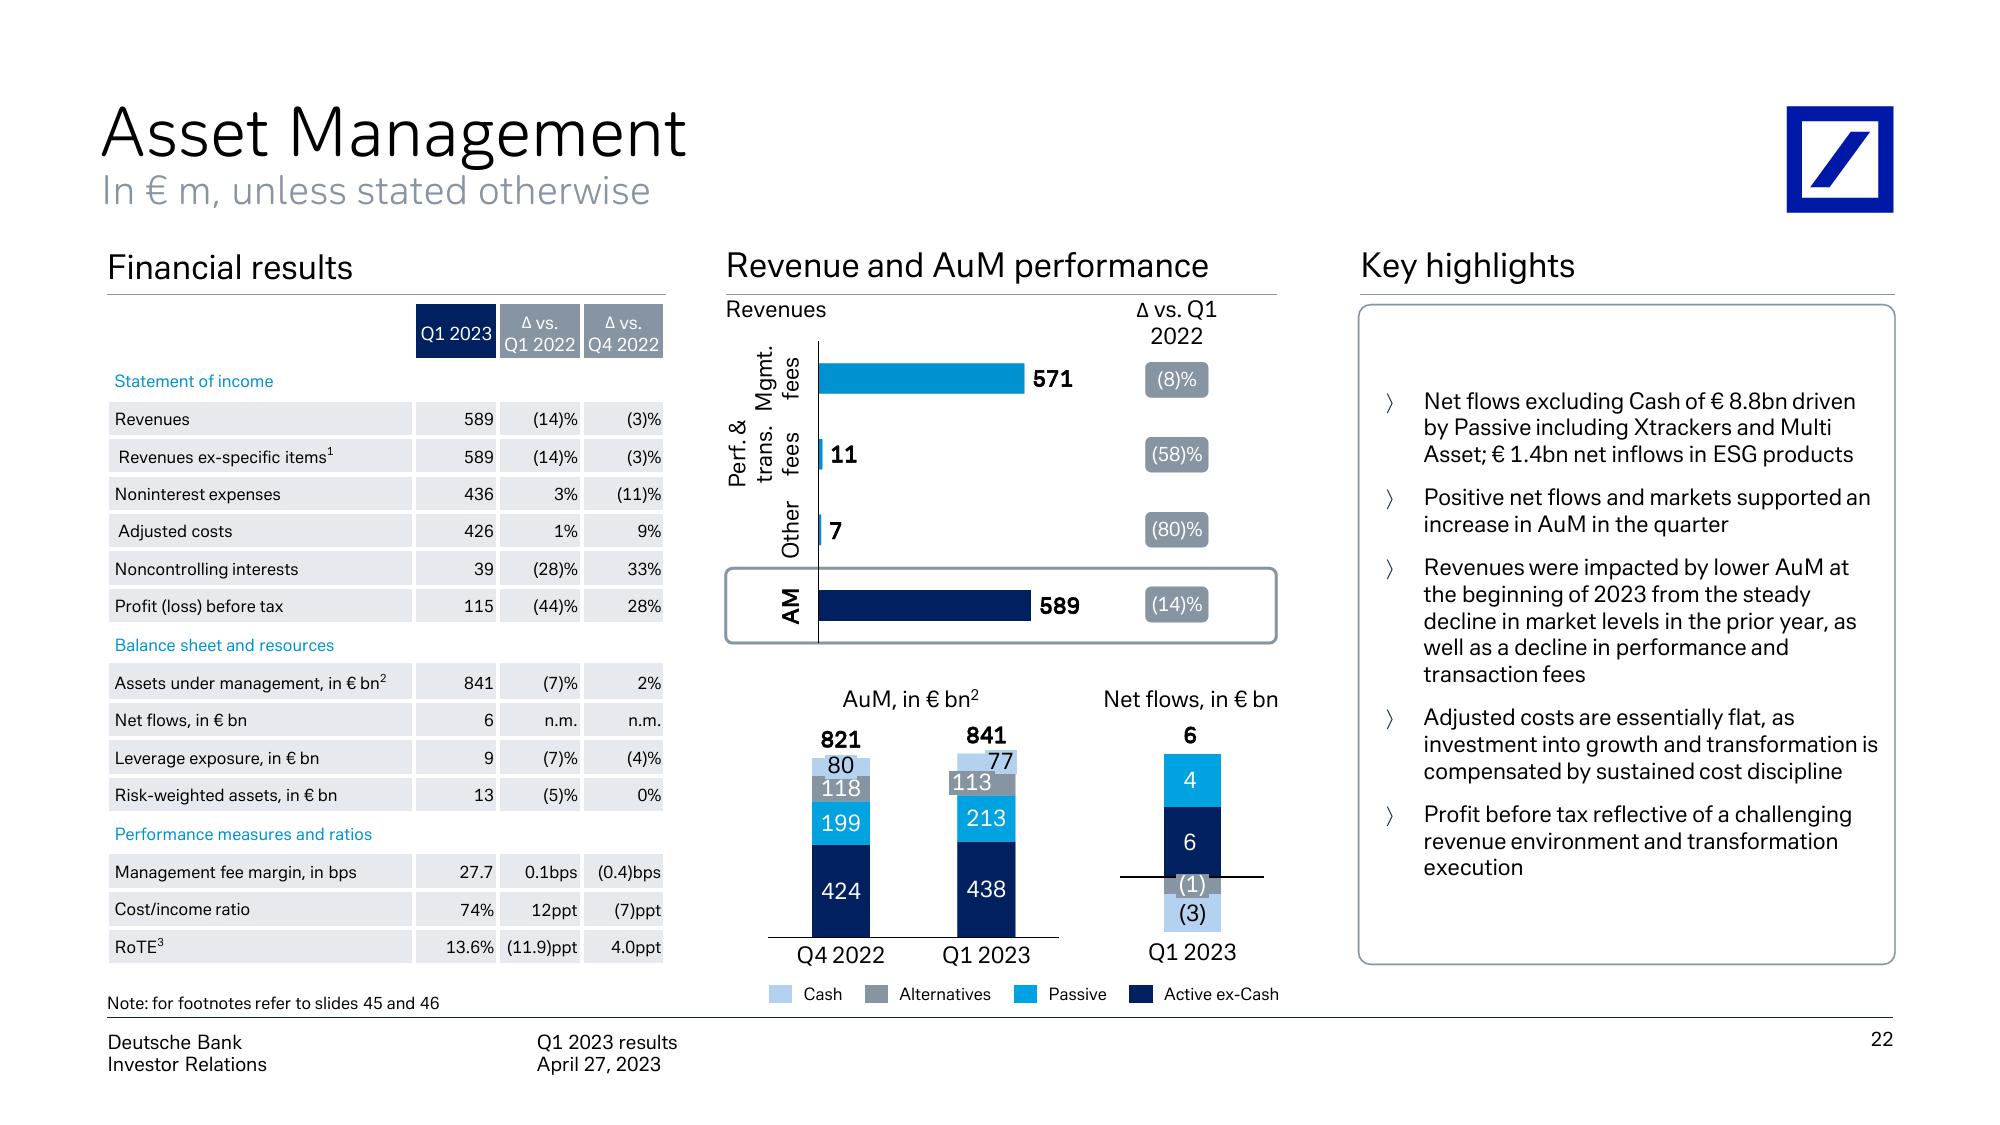
Net flows excluding Cash of € 8.8bn driven
by Passive including Xtrackers and Multi
Asset; € 1.4bn net inflows in ESG products
Positive net flows and markets supported an
increase in AuM in the quarter
Revenues were impacted by lower AuM at
the beginning of 2023 from the steady
decline in market levels in the prior year, as
well as a decline in performance and
transaction fees
> Adjusted costs are essentially flat, as
investment into growth and transformation is
compensated by sustained cost discipline
Profit before tax reflective of a challenging
revenue environment and transformation
execution
22View entire presentation