Morgan Stanley Investment Banking Pitch Book
Morgan Stanley
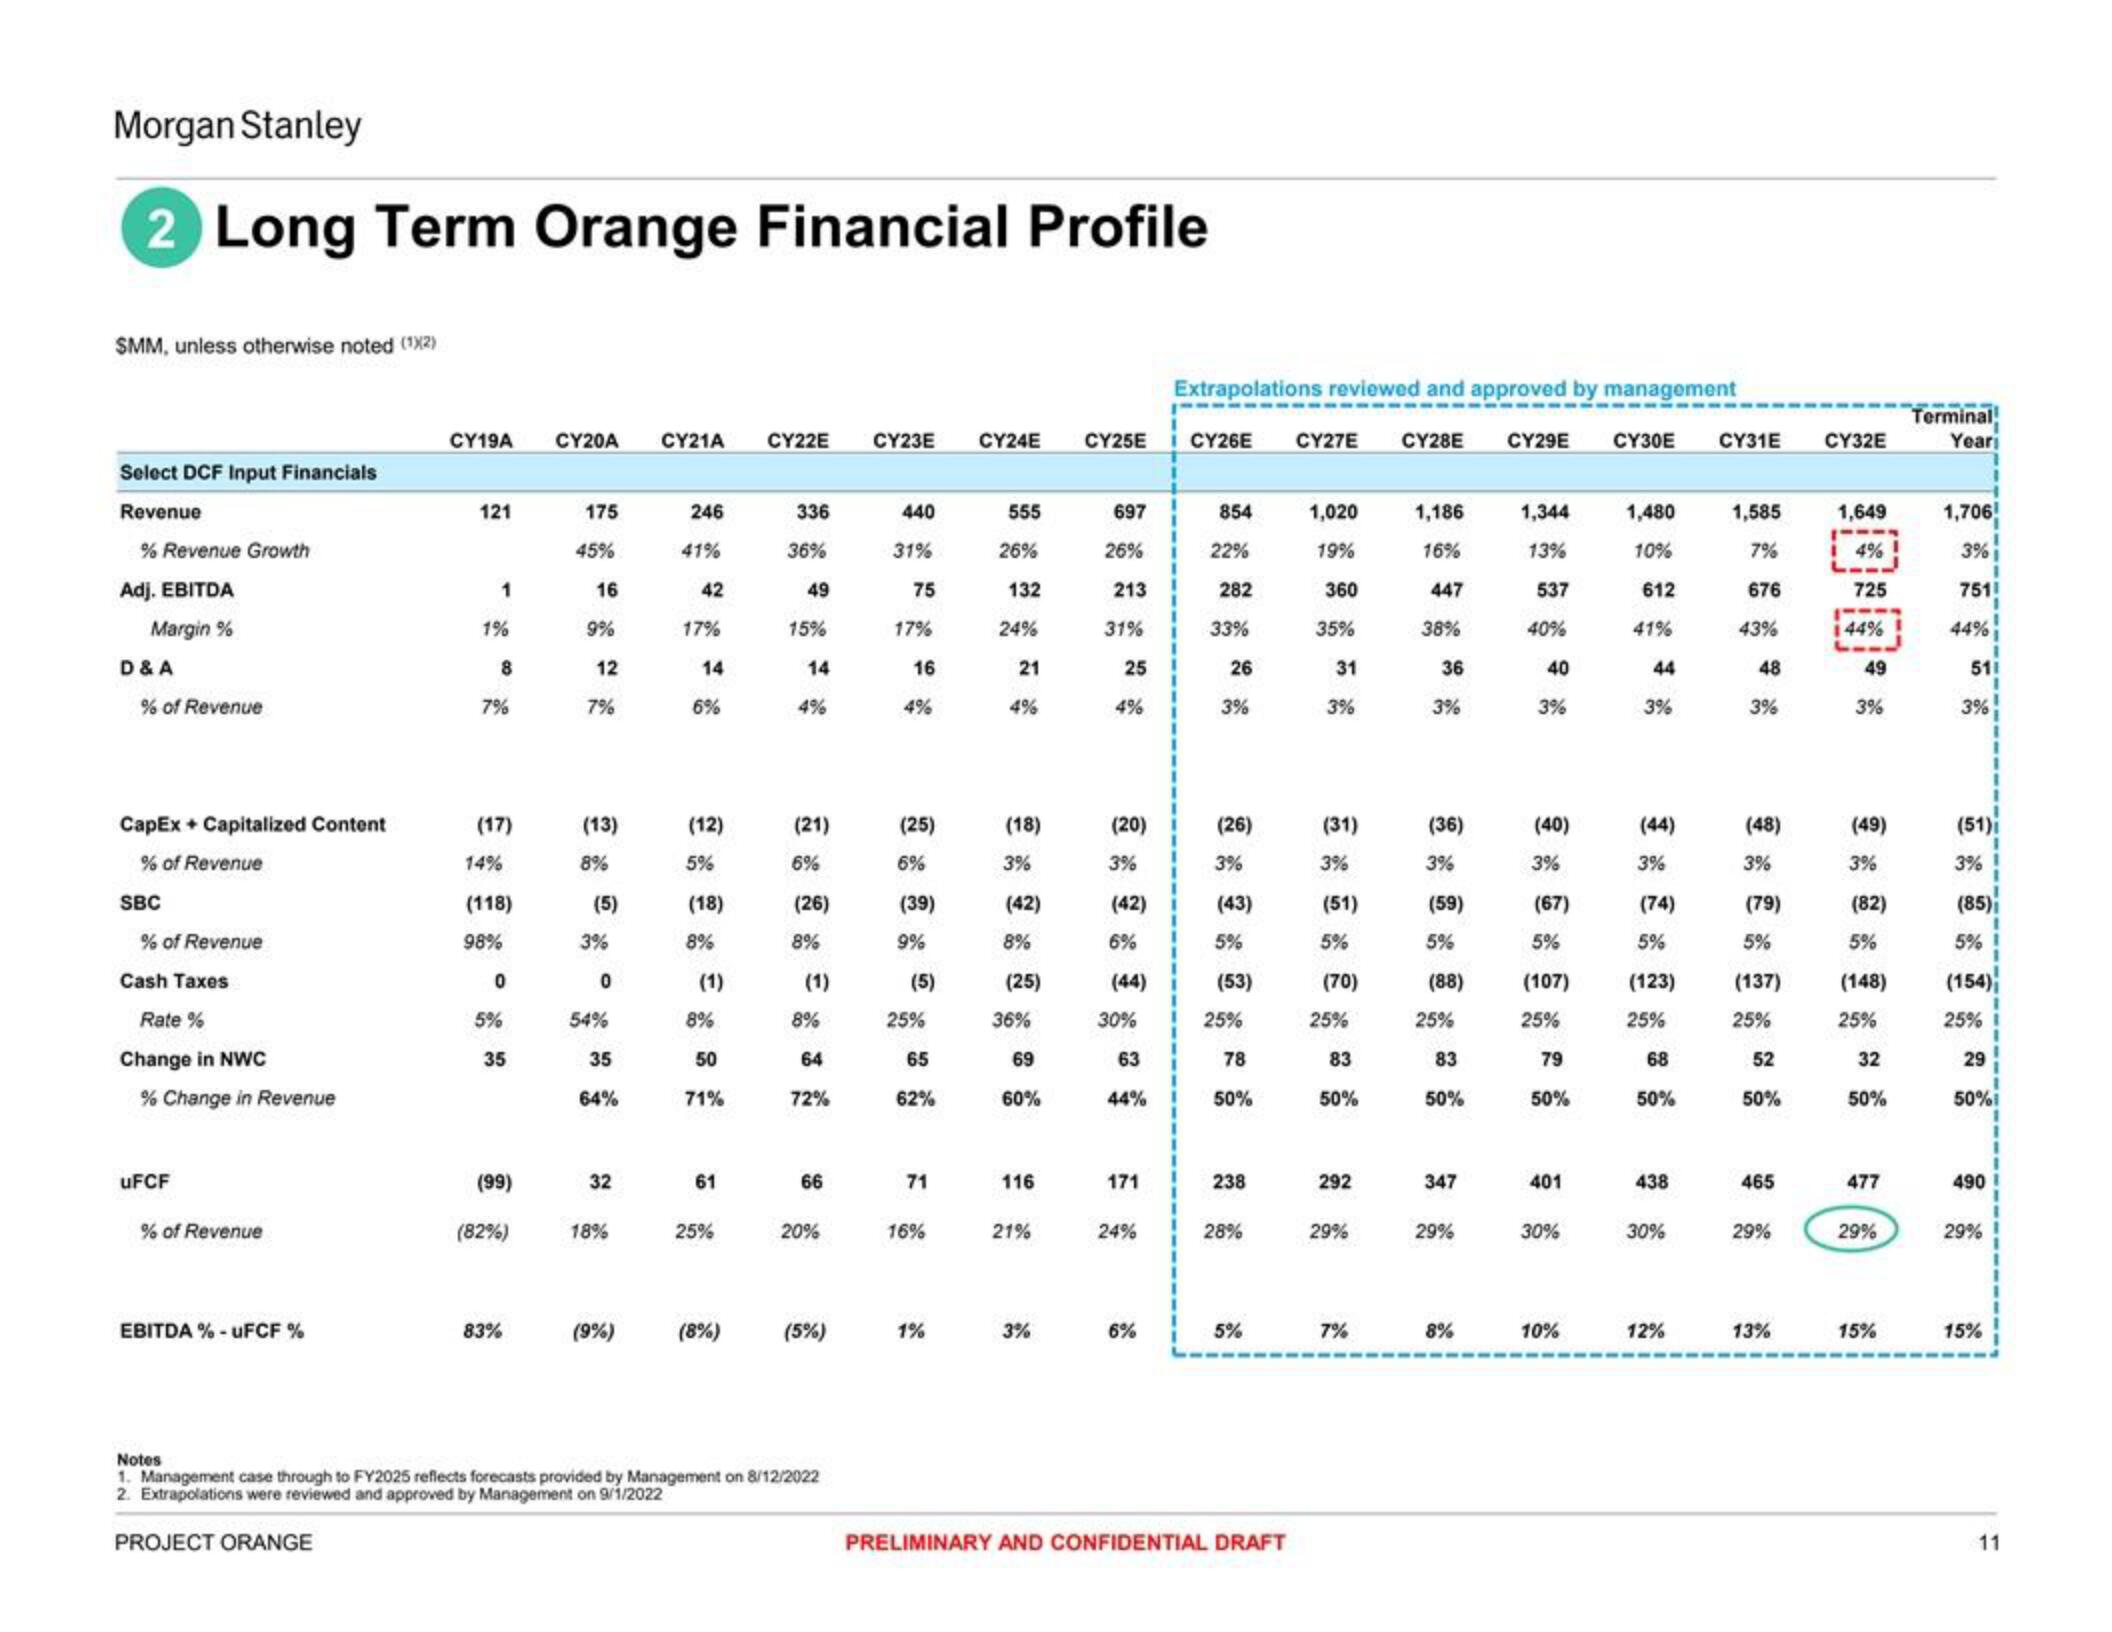
2 Long Term Orange Financial Profile
SMM, unless otherwise noted (¹X2)
Select DCF Input Financials
Revenue
% Revenue Growth
Adj. EBITDA
Margin %
D & A
% of Revenue
CapEx + Capitalized Content
% of Revenue
SBC
% of Revenue
Cash Taxes
Rate %
Change in NWC
% Change in Revenue
uFCF
% of Revenue
EBITDA % - uFCF%
CY19A
121
1
1%
8
7%
(17)
14%
(118)
98%
0
5%
35
(99)
(82%)
83%
CY20A
175
45%
16
9%
12
7%
(13)
8%
(5)
3%
0
54%
35
64%
32
18%
(9%)
CY21A CY22E CY23E
246
41%
42
17%
14
6%
(12)
5%
(18)
8%
(1)
8%
50
71%
61
25%
(8%)
336
36%
49
15%
14
(21)
6%
(26)
8%
8%
64
72%
66
20%
(5%)
Notes
1. Management case through to FY2025 reflects forecasts provided by Management on 8/12/2022
2. Extrapolations were reviewed and approved by Management on 9/1/2022
PROJECT ORANGE
440
31%
75
17%
16
(25)
6%
(39)
9%
(5)
25%
65
62%
71
16%
1%
Extrapolations reviewed and approved by management
CY24E CY25E CY26E CY27E CY28E CY29E
555
26%
132
24%
21
4%
(18)
3%
(42)
8%
(25)
36%
69
60%
116
21%
3%
697
26%
213
31%
25
4%
(20)
3%
(42)
6%
(44)
30%
63
44%
171
24%
6%
854
22%
282
33%
26
3%
(26)
3%
(43)
5%
(53)
25%
78
50%
238
28%
5%
PRELIMINARY AND CONFIDENTIAL DRAFT
1,020
19%
360
35%
31
3%
(31)
3%
(51)
5%
(70)
25%
83
50%
292
29%
7%
1,186
16%
447
38%
36
3%
(36)
3%
(59)
5%
(88)
25%
83
50%
347
29%
8%
1,344
13%
537
40%
40
3%
(40)
3%
(67)
5%
(107)
25%
79
50%
401
30%
10%
CY30E CY31E
1,480
10%
612
41%
44
3%
(44)
3%
(74)
5%
(123)
25%
68
50%
438
30%
12%
1,585
7%
676
43%
48
3%
(48)
3%
(79)
5%
(137)
25%
52
50%
465
29%
13%
CY32E
1,649
725
i 44%
49
3%
(49)
3%
(82)
5%
(148)
25%
32
50%
477
29%
15%
Terminal!
Year
1,706
3%
751!
44%
511
3%
(51)
3%
(85)
5%
(154)
25%
29
50%
490
29%
15%
11View entire presentation