Marti SPAC Presentation Deck
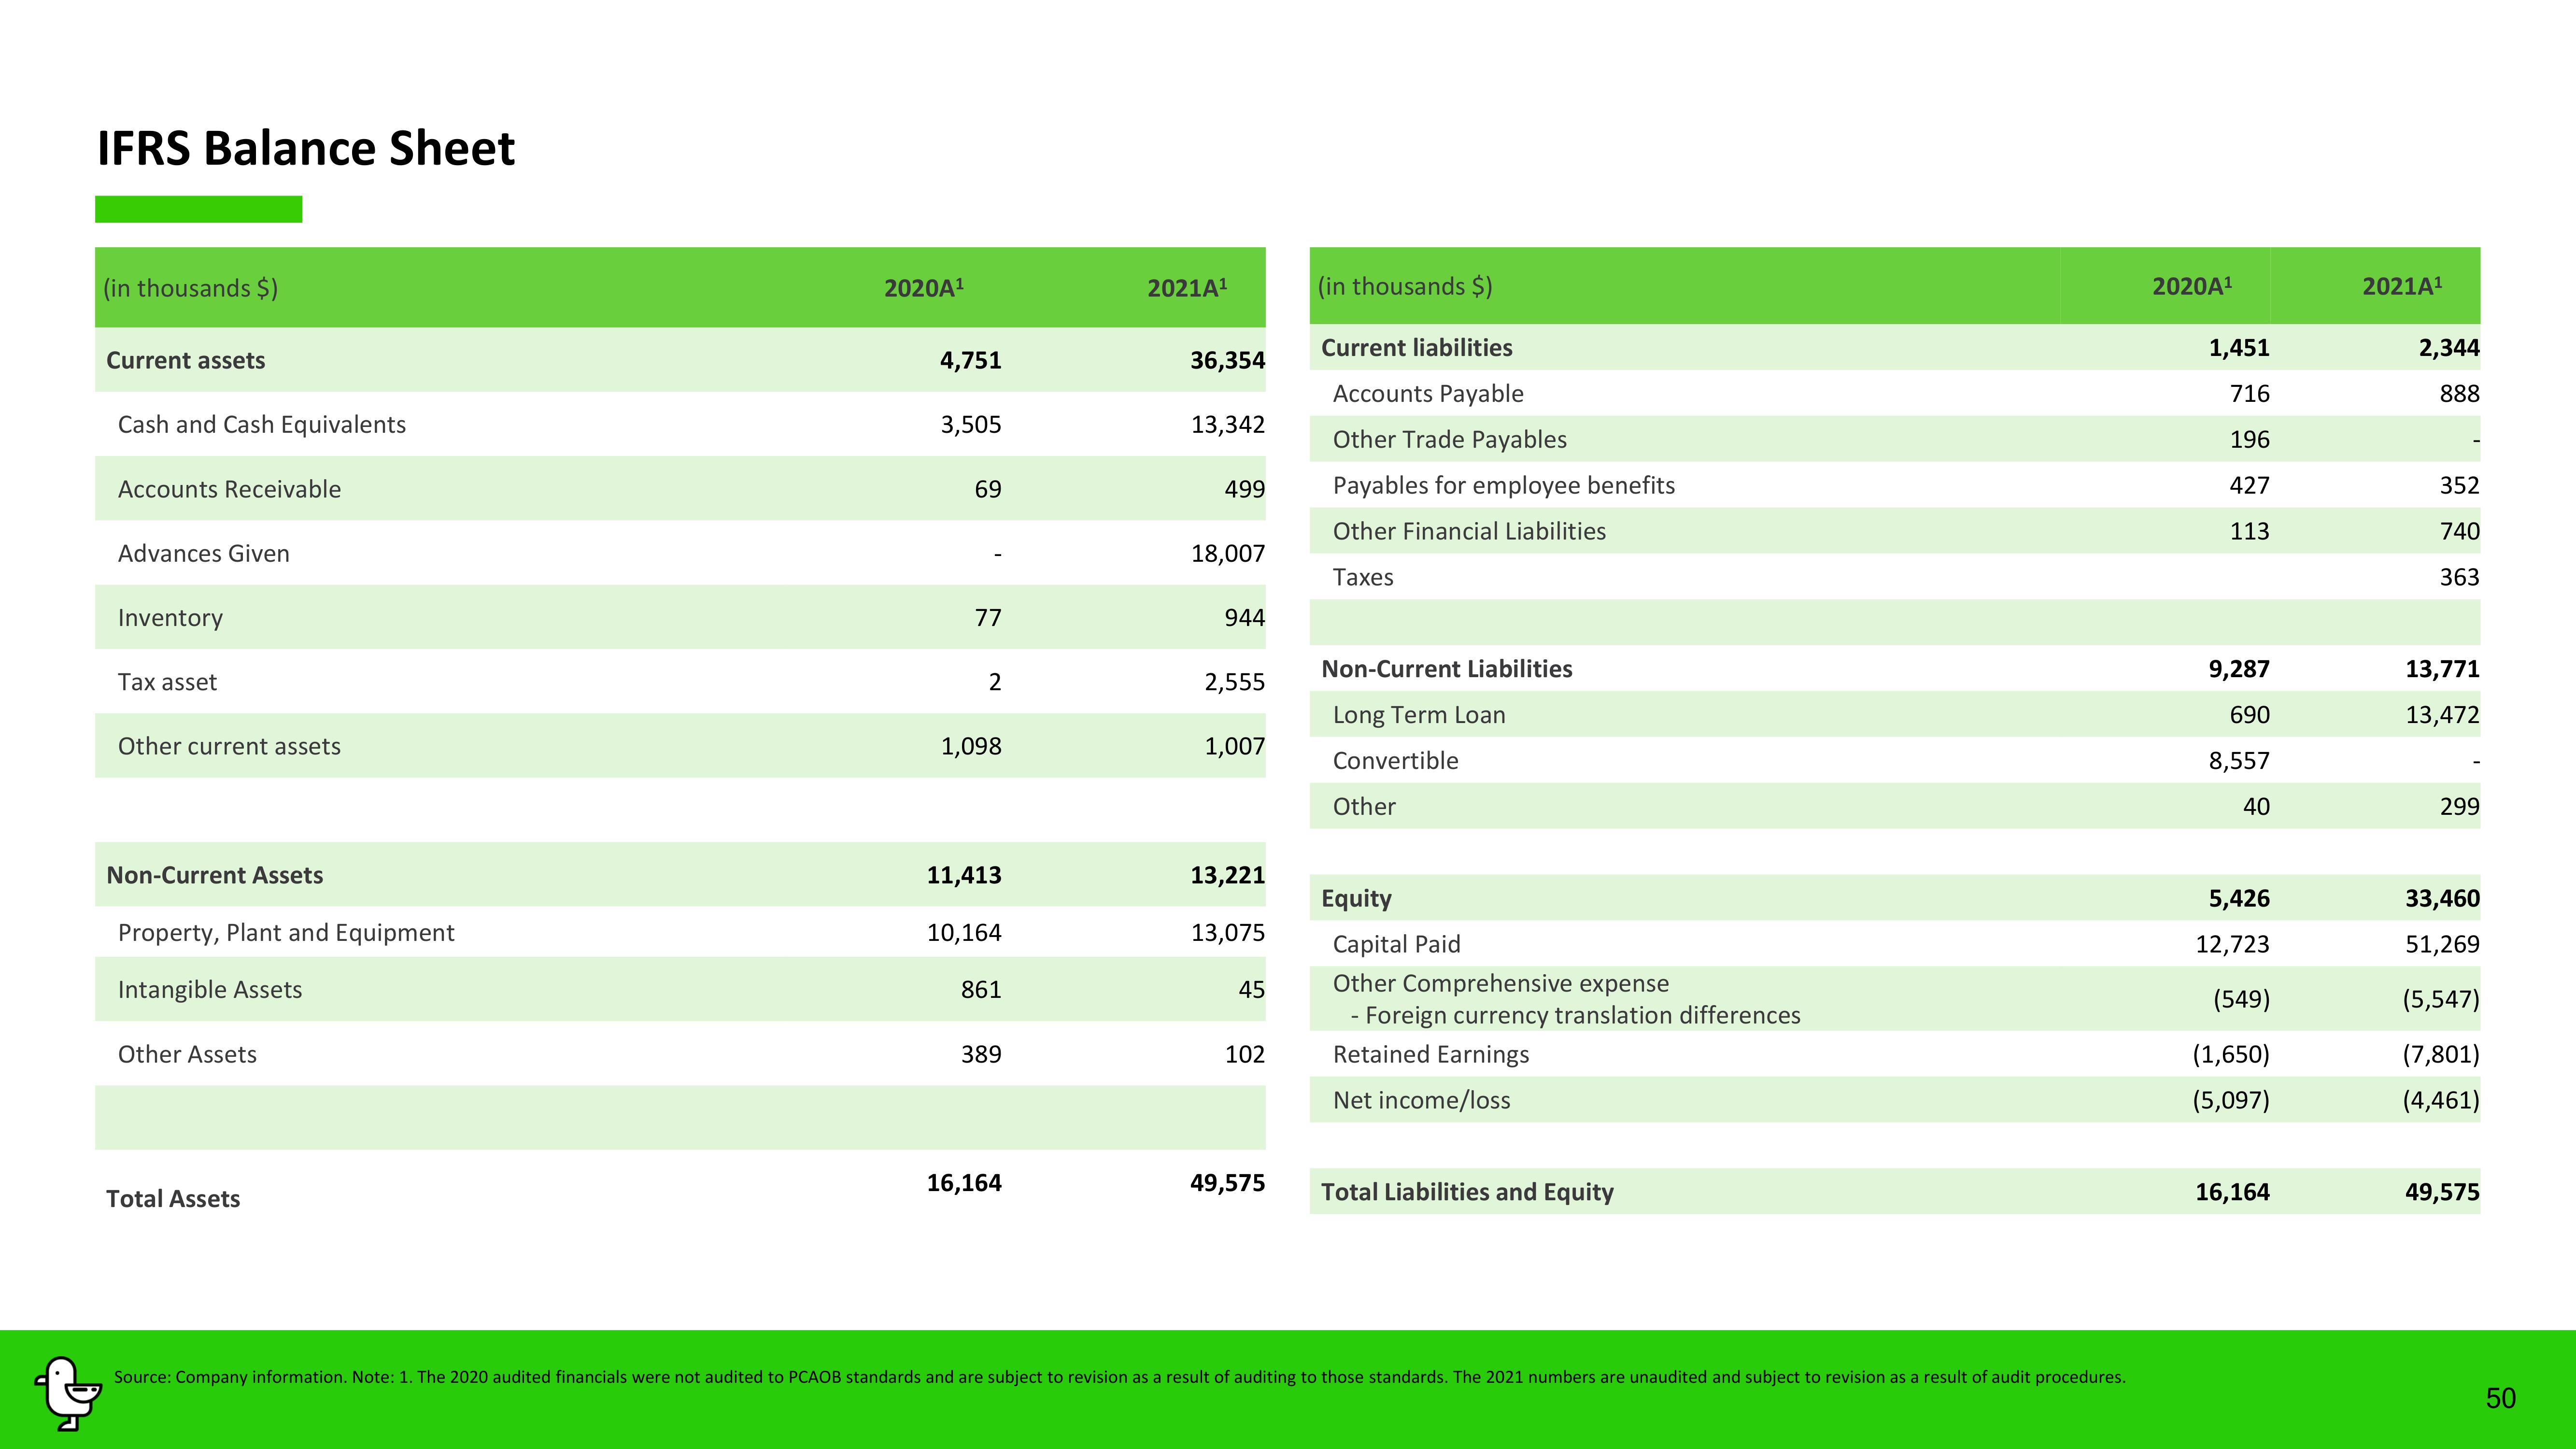
IFRS Balance Sheet
(in thousands $)
Current assets
Cash and Cash Equivalents
Accounts Receivable
Advances Given
Inventory
Tax asset
Other current assets
Non-Current Assets
Property, Plant and Equipment
Intangible Assets
Other Assets
Total Assets
2020A¹
4,751
3,505
69
77
2
1,098
11,413
10,164
861
389
16,164
2021A¹
36,354
13,342
499
18,007
944
2,555
1,007
13,221
13,075
45
102
49,575
(in thousands $)
Current liabilities
Accounts Payable
Other Trade Payables
Payables for employee benefits
Other Financial Liabilities
Taxes
Non-Current Liabilities
Long Term Loan
Convertible
Other
Equity
Capital Paid
Other Comprehensive expense
- Foreign currency translation differences
Retained Earnings
Net income/loss
Total Liabilities and Equity
Source: Company information. Note: 1. The 2020 audited financials were not audited to PCAOB standards and are subject to revision as a result of auditing to those standards. The 2021 numbers are unaudited and subject to revision as a result of audit procedures.
2020A¹
1,451
716
196
427
113
9,287
690
8,557
40
5,426
12,723
(549)
(1,650)
(5,097)
16,164
2021A¹
2,344
888
352
740
363
13,771
13,472
299
33,460
51,269
(5,547)
(7,801)
(4,461)
49,575
50View entire presentation