First Busey Results Presentation Deck
1
2Q23 Earnings Investor Presentation
First Busey Corporation | Ticker: BUSE
Actively Managing Asset-Sensitive Balance Sheet
■
■
■
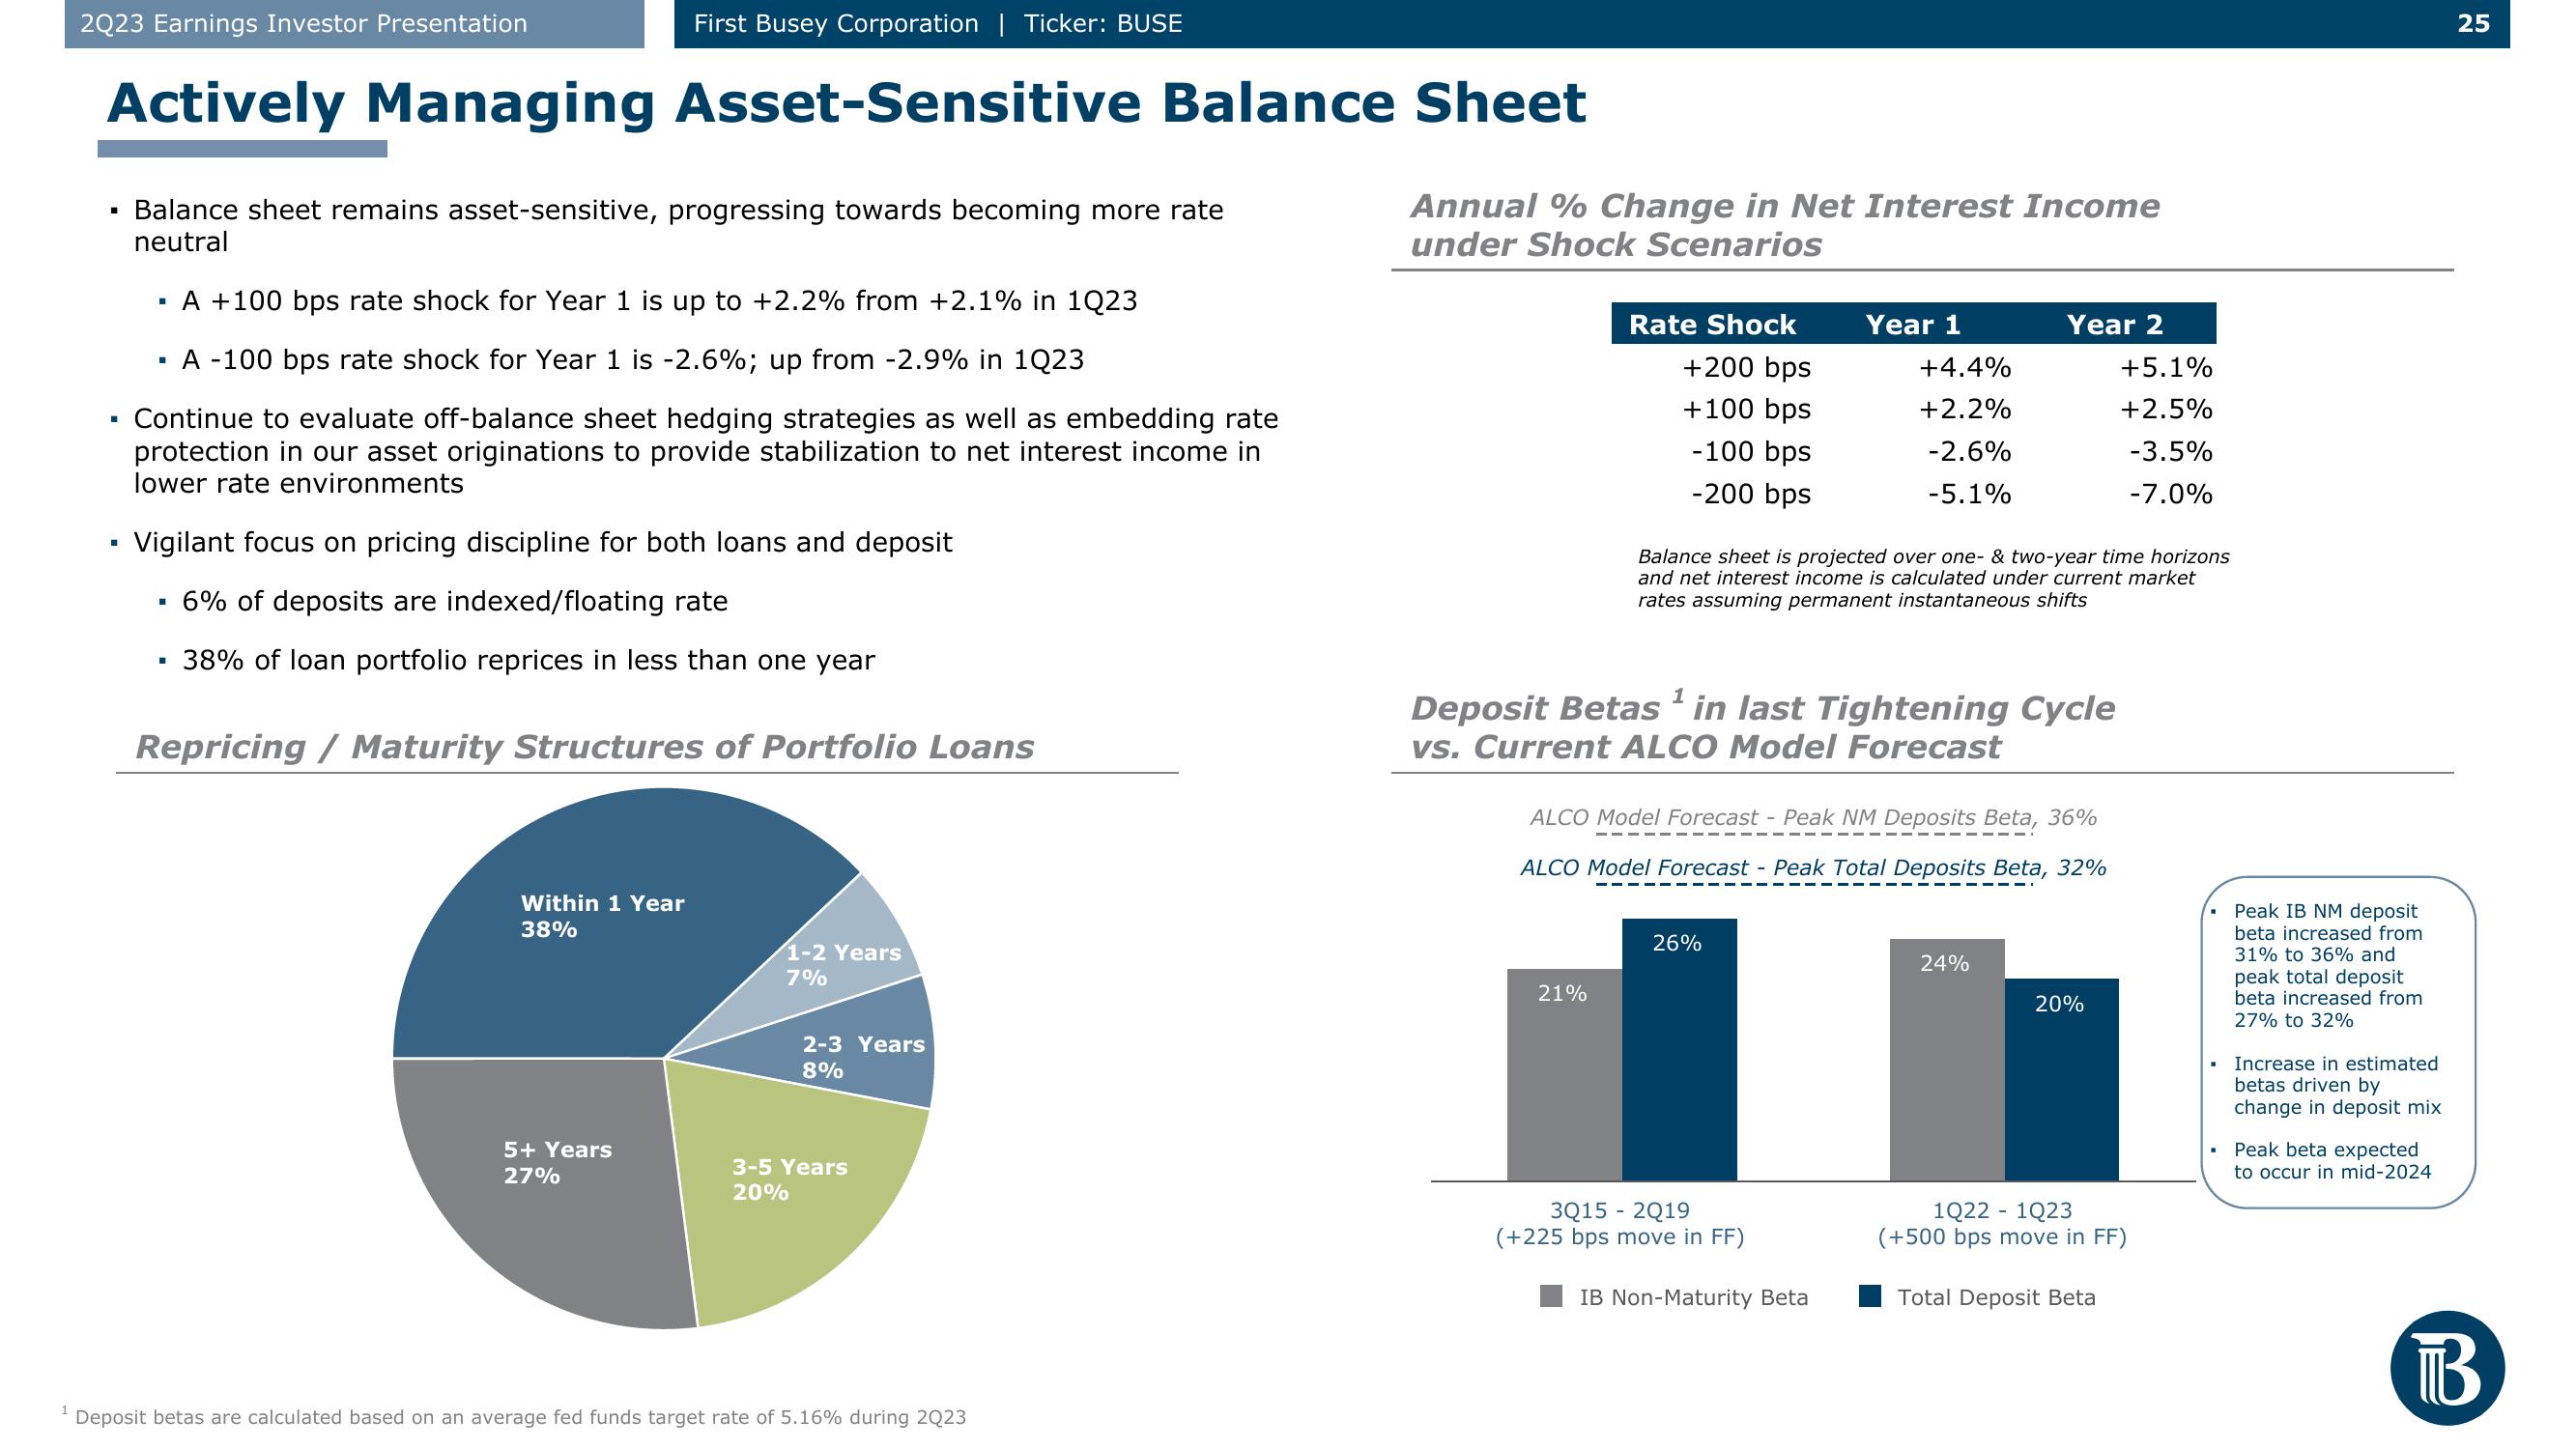
Balance sheet remains asset-sensitive, progressing towards becoming more rate
neutral
A +100 bps rate shock for Year 1 is up to +2.2% from +2.1% in 1Q23
A -100 bps rate shock for Year 1 is -2.6%; up from -2.9% in 1Q23
Continue to evaluate off-balance sheet hedging strategies as well as embedding rate
protection in our asset originations to provide stabilization to net interest income in
lower rate environments
Vigilant focus on pricing discipline for both loans and deposit
6% of deposits are indexed/floating rate
38% of loan portfolio reprices in less than one year
Repricing / Maturity Structures of Portfolio Loans
.
Within 1 Year
38%
5+ Years
27%
1-2 Years
7%
2-3 Years
8%
3-5 Years
20%
Deposit betas are calculated based on an average fed funds target rate of 5.16% during 2023
Annual % Change in Net Interest Income
under Shock Scenarios
Rate Shock
+200 bps
+100 bps
-100 bps
-200 bps
21%
Year 1
Deposit Betas¹ in last Tightening Cycle
vs. Current ALCO Model Forecast
26%
+4.4%
+2.2%
-2.6%
-5.1%
Balance sheet is projected over one- & two-year time horizons
and net interest income is calculated under current market
rates assuming permanent instantaneous shifts
ALCO Model Forecast - Peak NM Deposits Beta, 36%
ALCO Model Forecast - Peak Total Deposits Beta, 32%
3Q15 - 2019
(+225 bps move in FF)
IB Non-Maturity Beta
Year 2
24%
+5.1%
+2.5%
-3.5%
-7.0%
20%
1Q22- 1Q23
(+500 bps move in FF)
Total Deposit Beta
Peak IB NM deposit
beta increased from
31% to 36% and
peak total deposit
beta increased from
27% to 32%
Increase in estimated
betas driven by
change in deposit mix
Peak beta expected
to occur in mid-2024
25
B ТВView entire presentation