dLocal Investor Day Presentation Deck
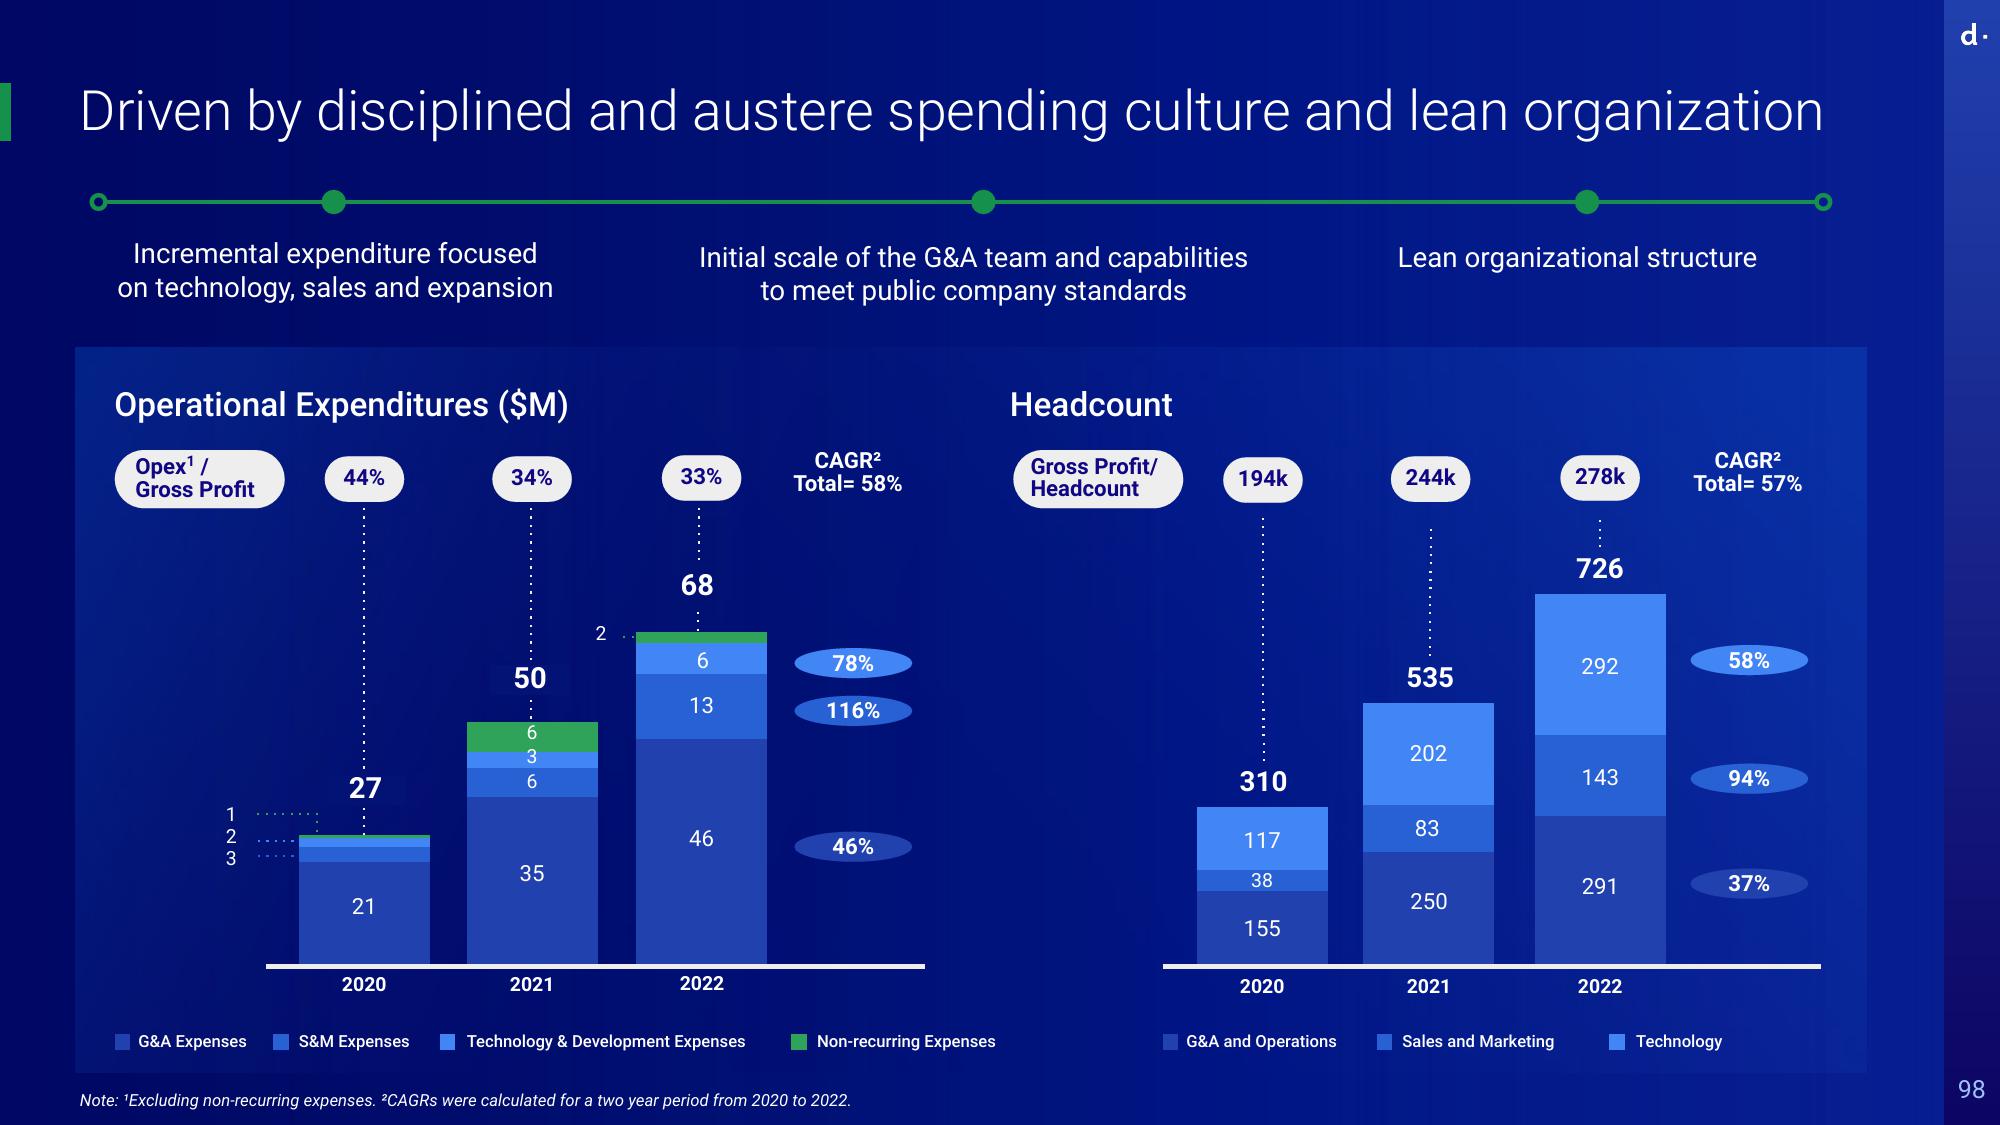
Driven by disciplined and austere spending culture and lean organization
Initial scale of the G&A team and capabilities
to meet public company standards
Incremental expenditure focused
on technology, sales and expansion
Operational Expenditures ($M)
Opex¹ /
Gross Profit
123
G&A Expenses
44%
27
21
2020
S&M Expenses
34%
50
3
35
2021
2
33%
68
6
13
46
2022
Technology & Development Expenses
CAGR²
Total= 58%
78%
116%
46%
Non-recurring Expenses
Note: ¹Excluding non-recurring expenses. CAGRS were calculated for a two year period from 2020 to 2022.
Headcount
Gross Profit/
Headcount
194k
310
117
38
155
2020
G&A and Operations
Lean organizational structure
244k
535
202
83
250
2021
Sales and Marketing
278k
726
292
143
291
2022
CAGR²
Total= 57%
Technology
58%
94%
37%
d.
98View entire presentation