J.P.Morgan Results Presentation Deck
JPMORGAN CHASE & CO.
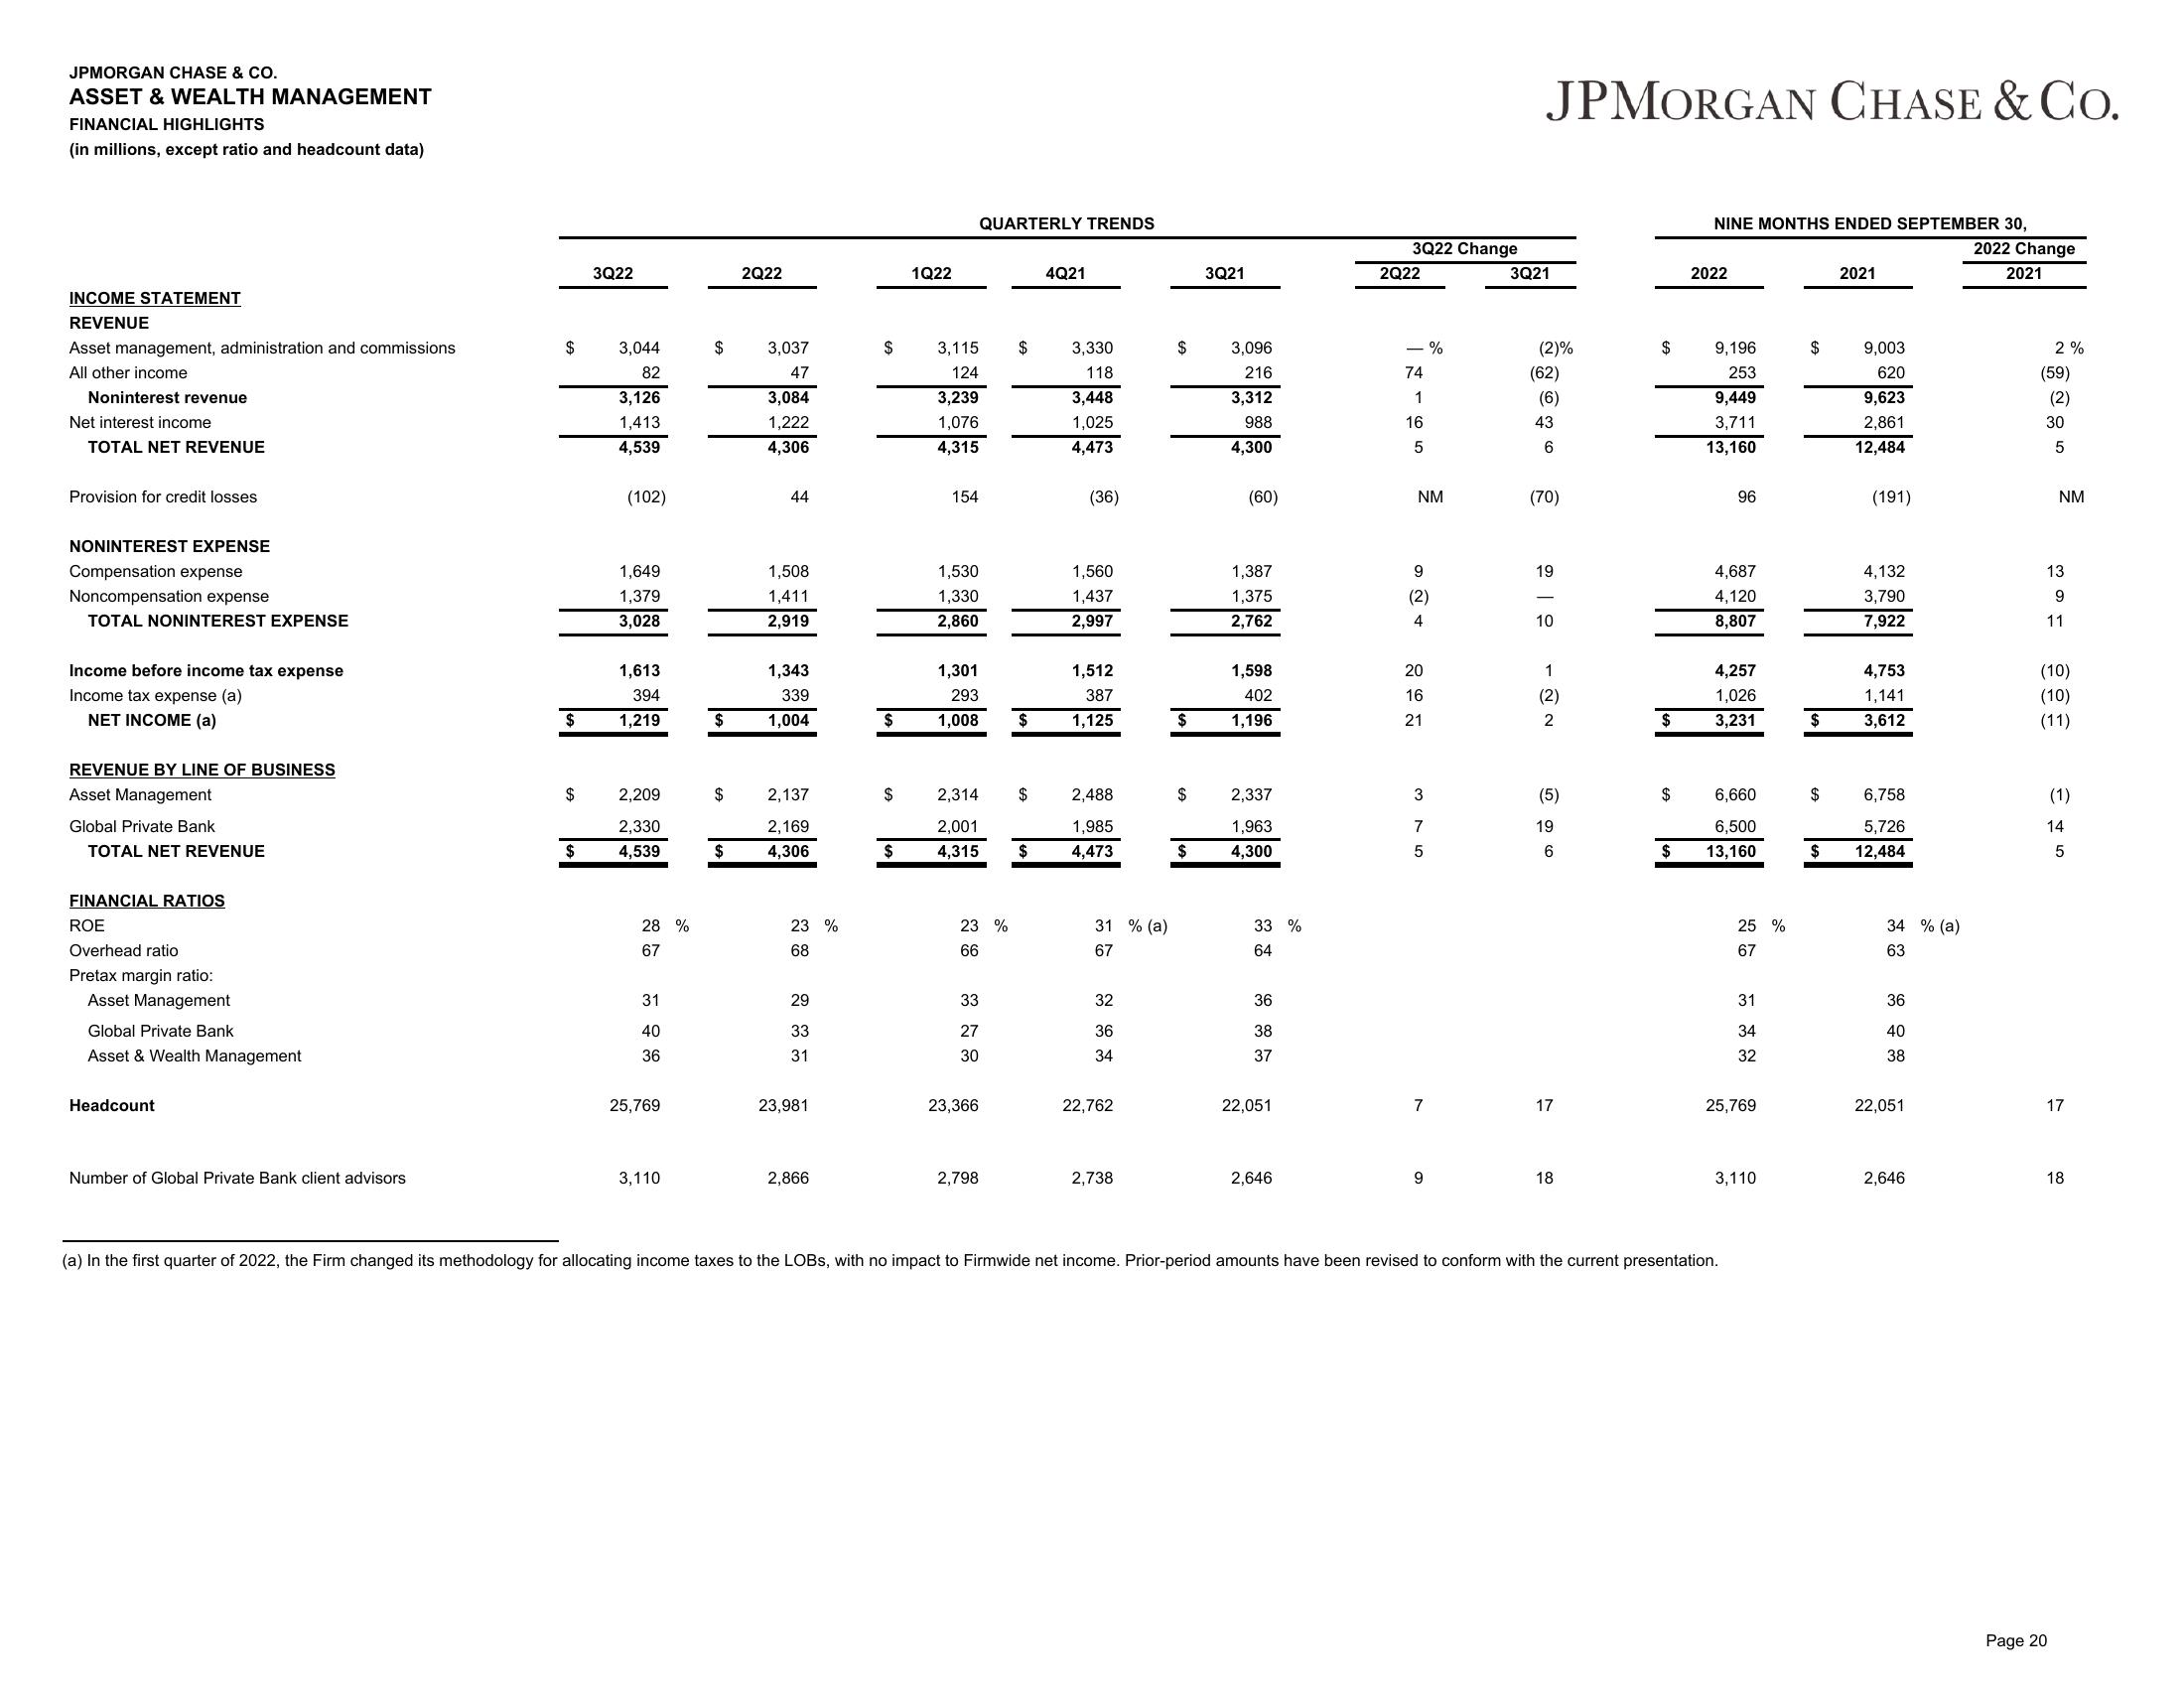
ASSET & WEALTH MANAGEMENT
FINANCIAL HIGHLIGHTS
(in millions, except ratio and headcount data)
INCOME STATEMENT
REVENUE
Asset management, administration and commissions
All other income
Noninterest revenue
Net interest income
TOTAL NET REVENUE
Provision for credit losses
NONINTEREST EXPENSE
Compensation expense
Noncompensation expense
TOTAL NONINTEREST EXPENSE
Income before income tax expense
Income tax expense (a)
NET INCOME (a)
REVENUE BY LINE OF BUSINESS
Asset Management
Global Private Bank
TOTAL NET REVENUE
FINANCIAL RATIOS
ROE
Overhead ratio
Pretax margin ratio:
Asset Management
Global Private Bank
Asset & Wealth Management
Headcount
Number of Global Private Bank client advisors
$
$
$
$
3Q22
3,044
82
3,126
1,413
4,539
(102)
1,649
1,379
3,028
1,613
394
1,219
2,209
2,330
4,539
28 %
67
31
40
36
25,769
3,110
$
$
$
2Q22
3,037
47
3,084
1,222
4,306
44
1,508
1,411
2,919
1,343
339
1,004
2,137
2,169
4,306
23 %
68
29
33
31
23,981
2,866
$
$
$
1Q22
QUARTERLY TRENDS
3,115
124
3,239
1,076
4,315
154
1,530
1,330
2,860
1,301
293
1,008
$ 4,315
2,314 $
2,001
23 %
66
33
27
30
23,366
$
2,798
$
$
4Q21
3,330
118
3,448
1,025
4,473
(36)
1,560
1,437
2,997
1,512
387
1,125
2,488
1,985
4,473
31 % (a)
67
32
36
34
22,762
2,738
$
$
$
$
3Q21
3,096
216
3,312
988
4,300
(60)
1,387
1,375
2,762
1,598
402
1,196
2,337
1,963
4,300
33 %
64
36
38
37
22,051
2,646
3Q22 Change
2Q22
- %
74
1
16
5
NM
9
(2)
4
20
16
21
375
7
9
JPMORGAN CHASE & CO.
3Q21
(2)%
(62)
(6)
43
6
(70)
19
10
1
(2)
(5)
19
6
17
18
$
$
$
$
NINE MONTHS ENDED SEPTEMBER 30,
2022
9,196
253
9,449
3,711
13,160
96
4,687
4,120
8,807
4,257
1,026
3,231
6,660
6,500
13,160
25 %
67
(a) In the first quarter of 2022, the Firm changed its methodology for allocating income taxes to the LOBS, with no impact to Firmwide net income. Prior-period amounts have been revised to conform with the current presentation.
31
34
32
25,769
3,110
$
$
$
$
2021
9,003
620
9,623
2,861
12,484
(191)
4,132
3,790
7,922
4,753
1,141
3,612
6,758
5,726
12,484
34 % (a)
63
36
40
38
22,051
2,646
2022 Change
2021
2%
(59)
(2)
30
5
NM
13
9
11
(10)
(10)
(11)
Page 20
(1)
14
5
17
18View entire presentation