Wix Investor Day Presentation Deck
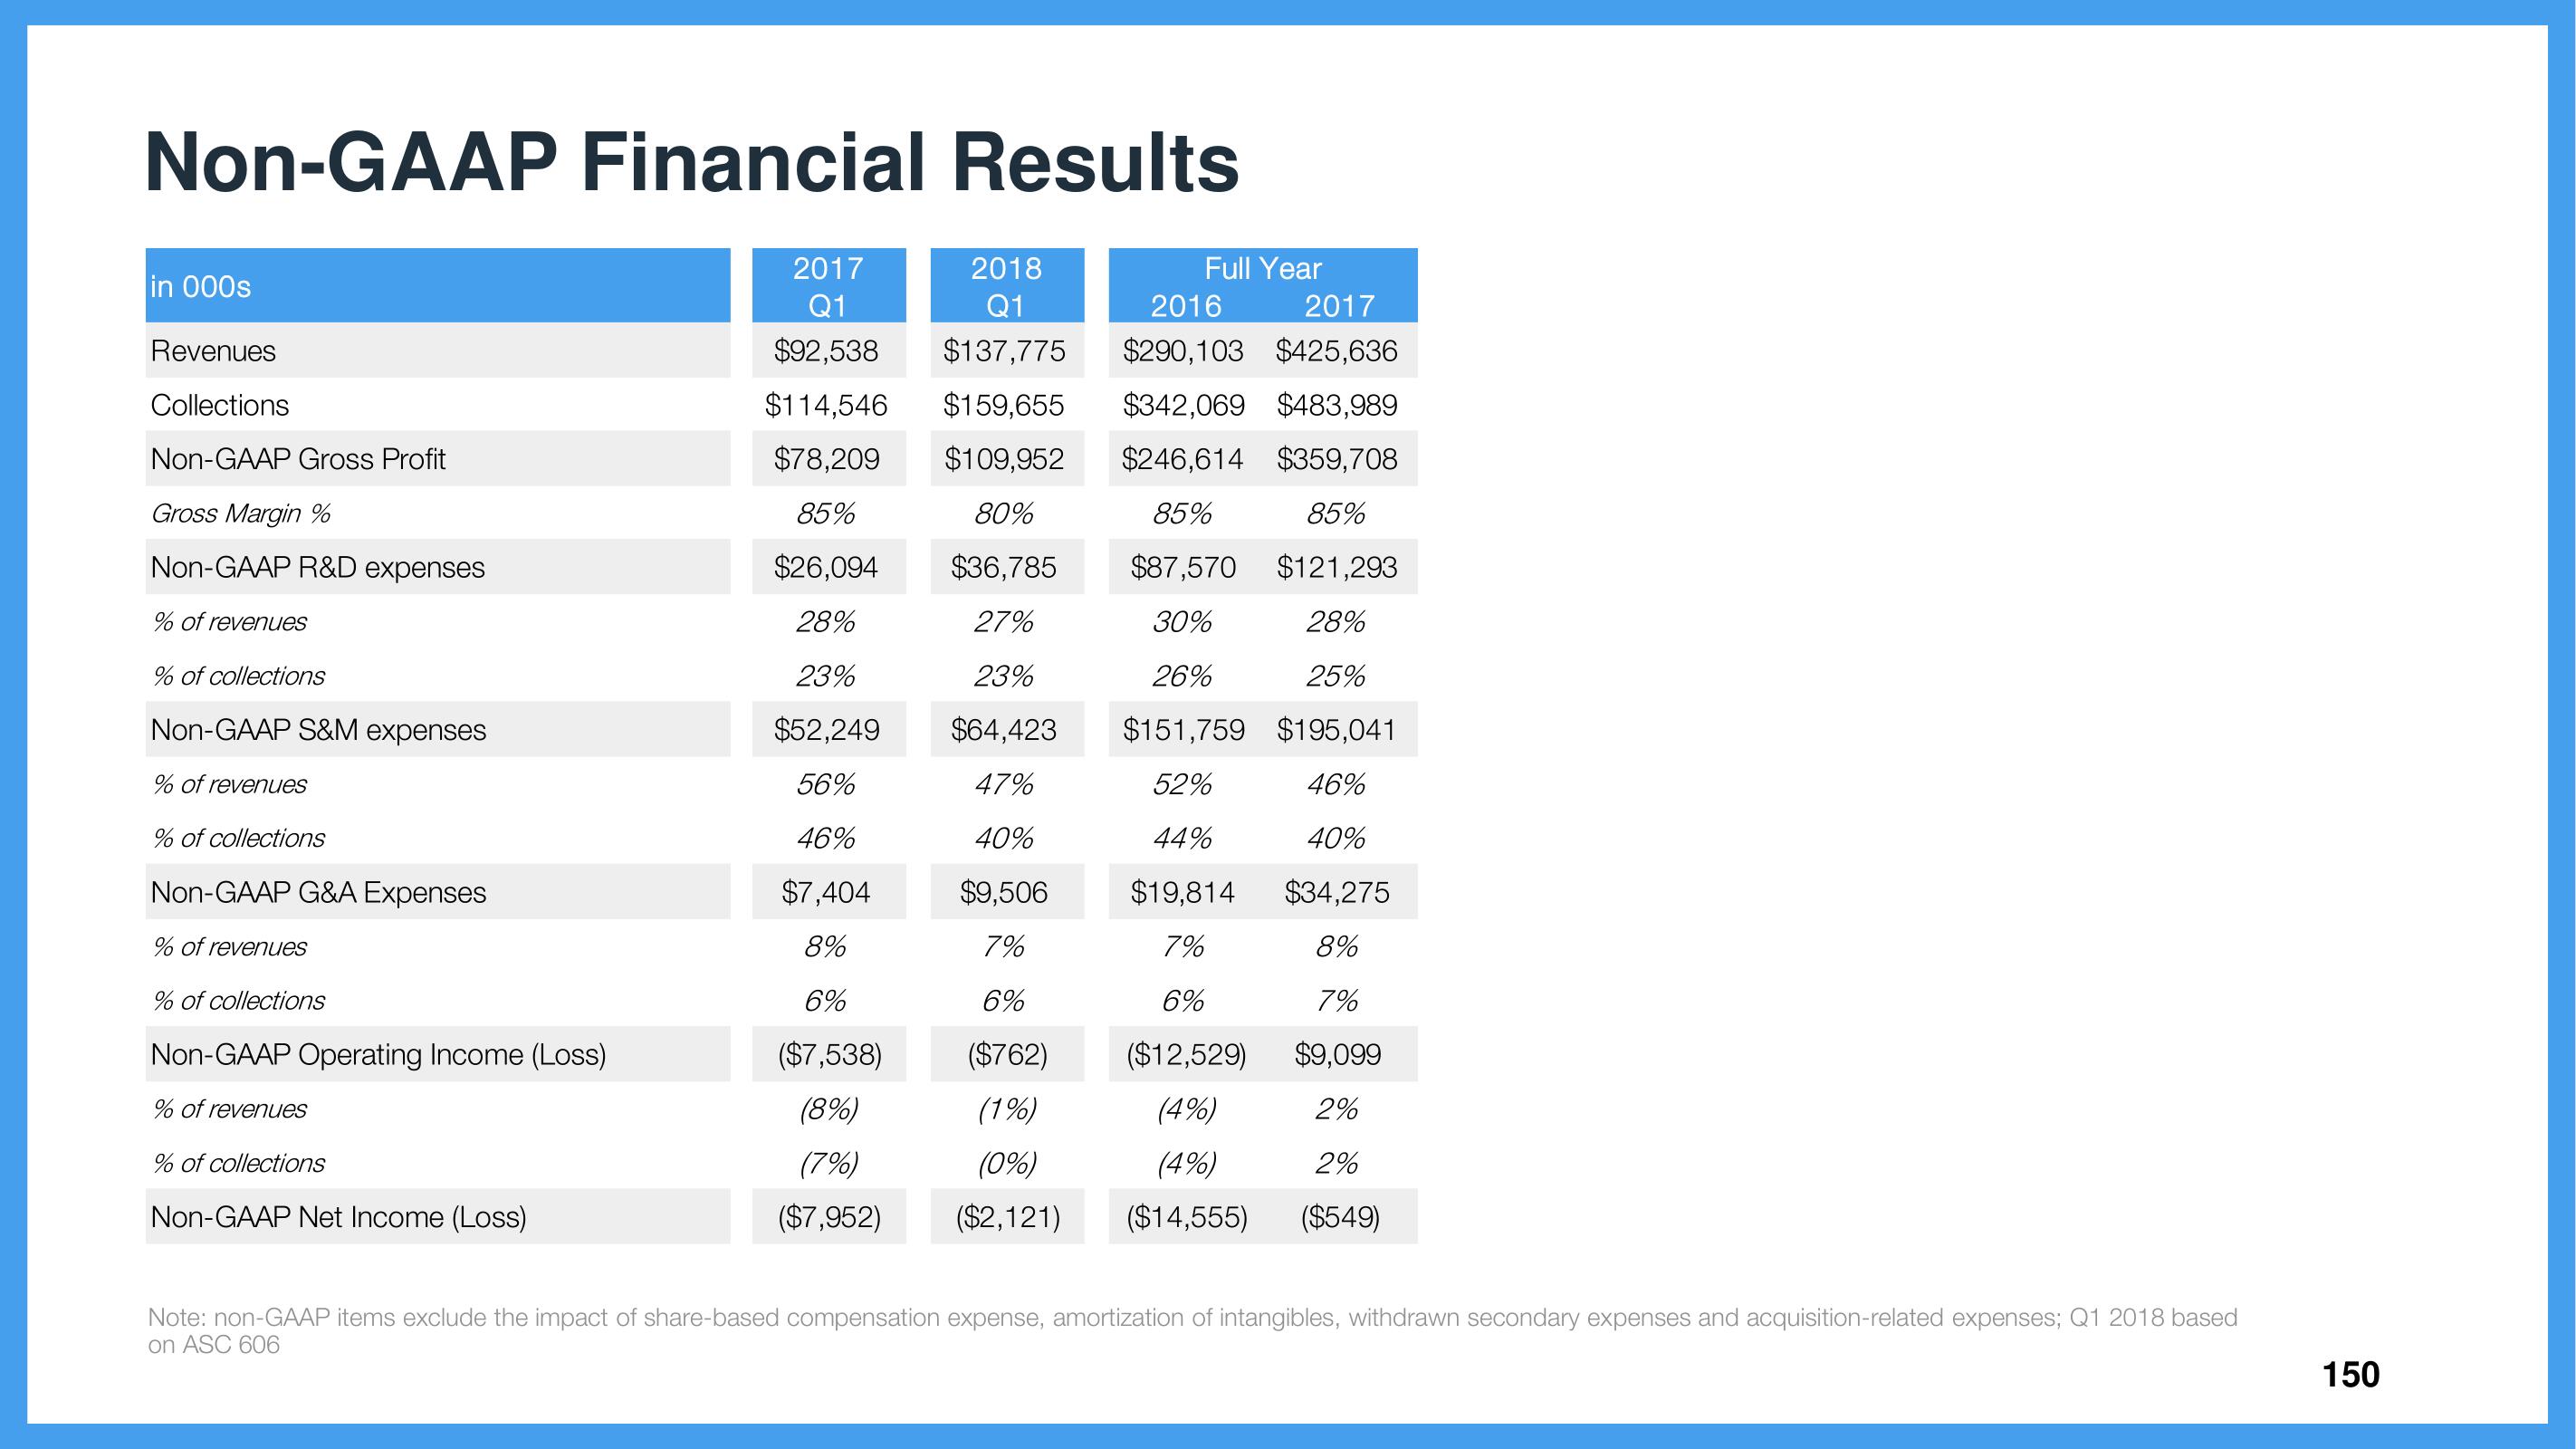
Non-GAAP Financial Results
2017
Q1
$92,538
$114,546
$342,069 $483,989
$159,655
$109,952 $246,614 $359,708
$78,209
85%
80%
$36,785
85%
$87,570
30%
85%
$121,293
$26,094
28%
27%
28%
23%
23%
26%
25%
$52,249 $64,423
$151,759
$195,041
56%
47%
52%
46%
46%
40%
44%
40%
$7,404 $9,506
$19,814
$34,275
8%
7%
7%
8%
6%
6%
6%
7%
$9,099
($7,538)
($762)
($12,529)
(8%)
(1%)
(4%)
2%
(7%)
(0%)
(4%)
2%
($7,952)
2) ($2,121) ($14,555)
($549)
in 000s
Revenues
Collections
Non-GAAP Gross Profit
Gross Margin %
Non-GAAP R&D expenses
% of revenues
% of collections
Non-GAAP S&M expenses
% of revenues
% of collections
Non-GAAP G&A Expenses
% of revenues
% of collections
Non-GAAP Operating Income (Loss)
% of revenues
% of collections
Non-GAAP Net Income (Loss)
2018
Full Year
2017
2016
Q1
$137,775 $290,103 $425,636
Note: non-GAAP items exclude the impact of share-based compensation expense, amortization of intangibles, withdrawn secondary expenses and acquisition-related expenses; Q1 2018 based
on ASC 606
150View entire presentation