Tradeweb Investor Presentation Deck
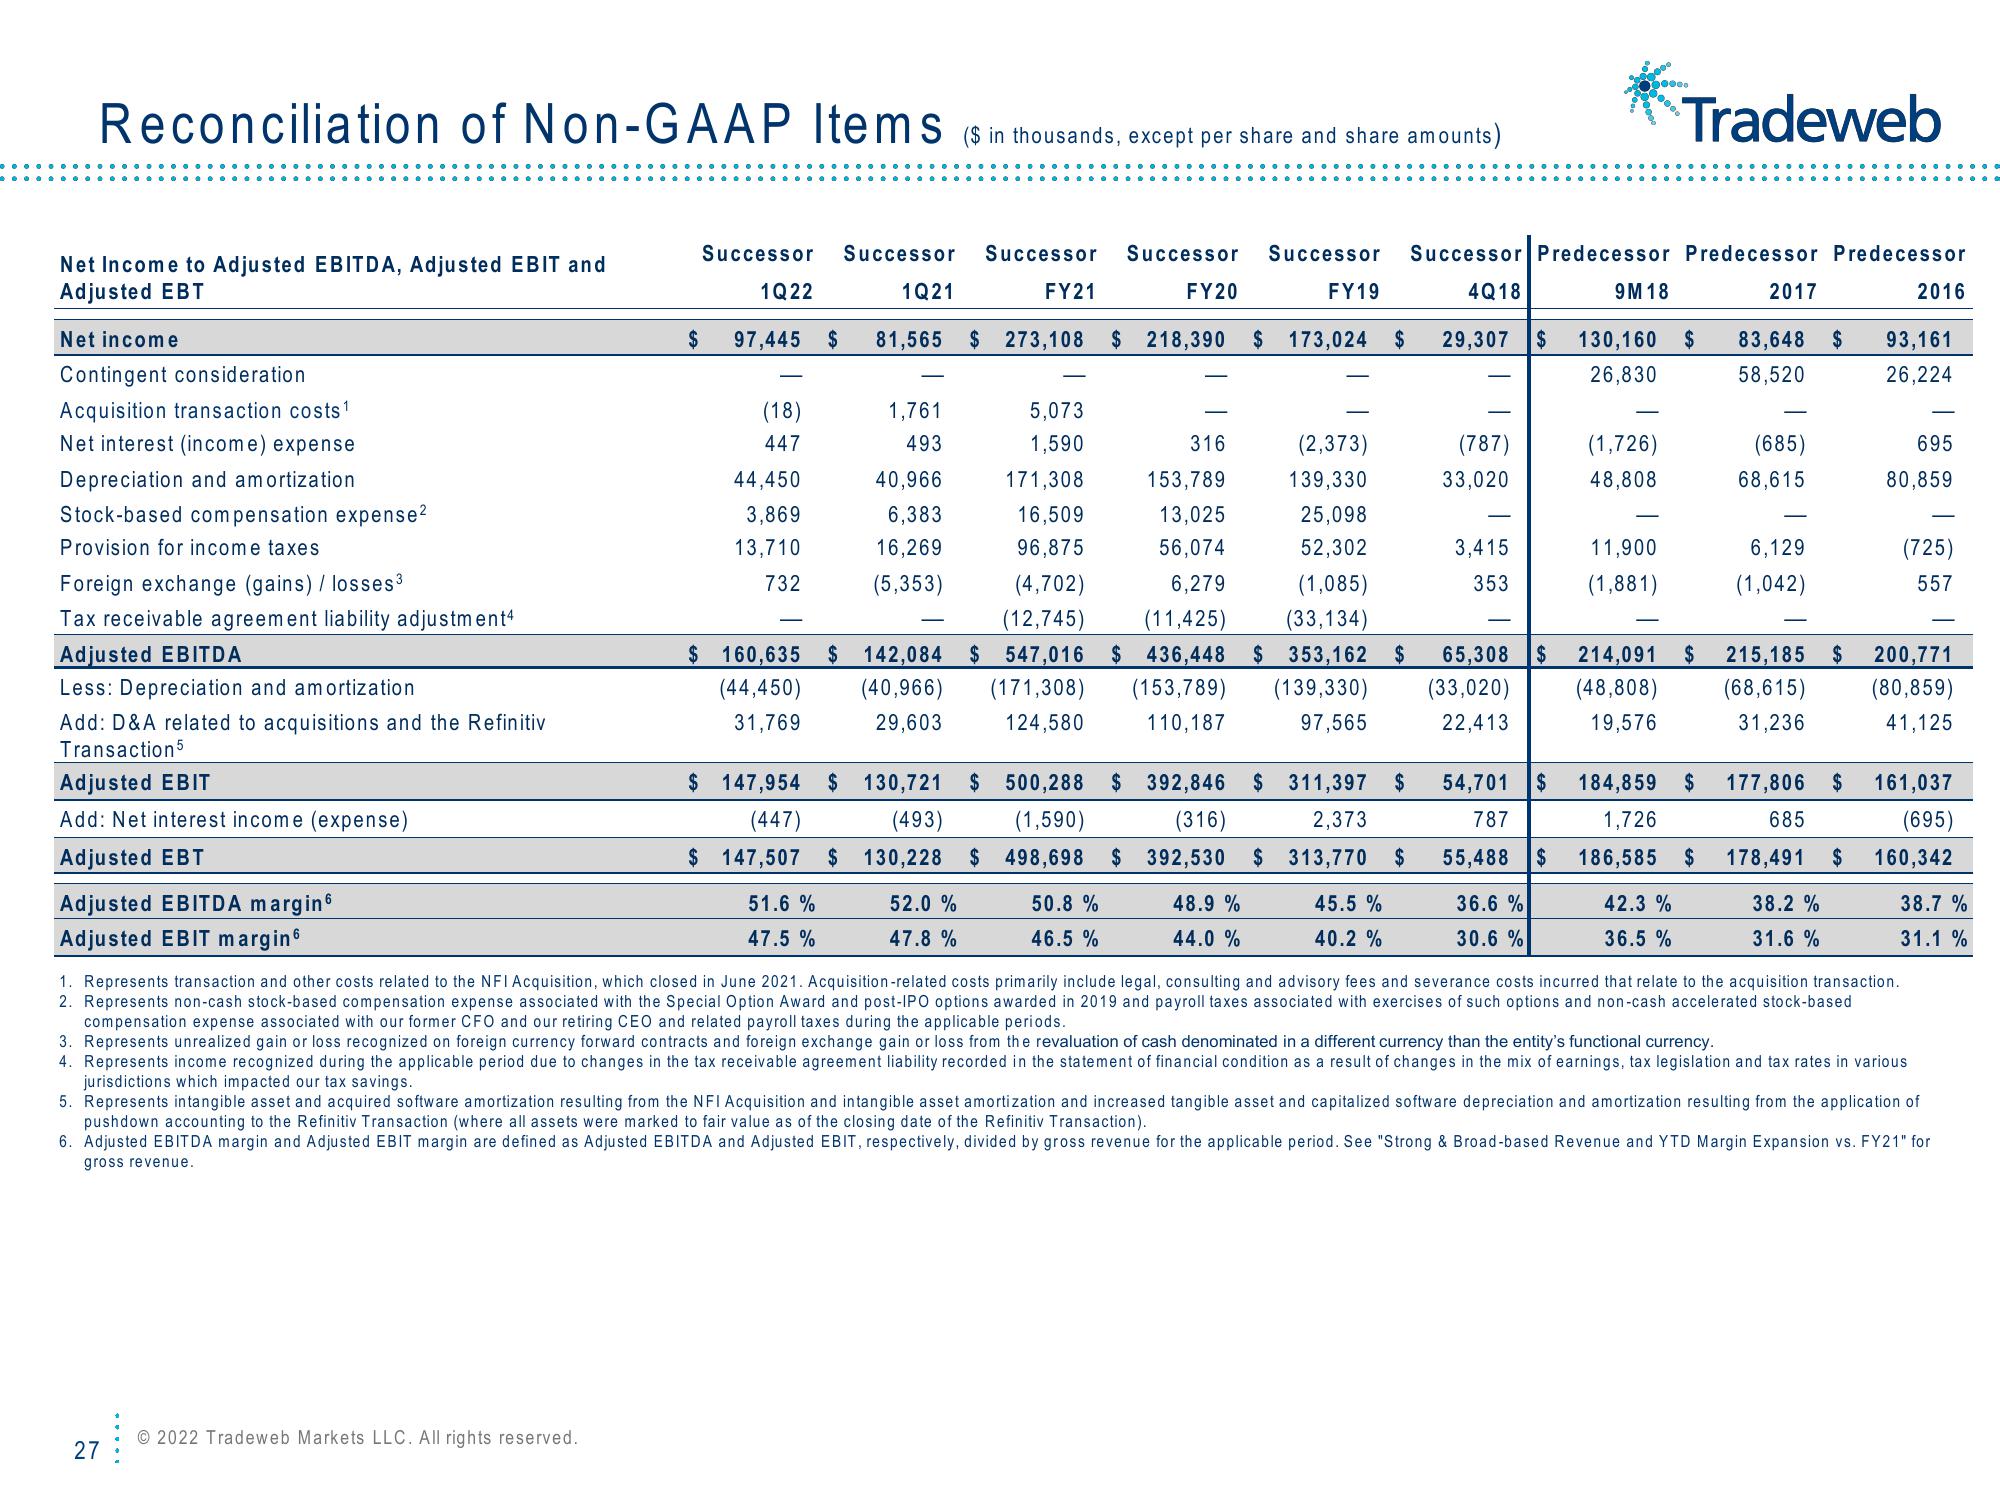
Reconciliation of Non-GAAP Items (sin thousands, except per share and share amounts)
Net Income to Adjusted EBITDA, Adjusted EBIT and
Adjusted EBT
Net income
Contingent consideration
Acquisition transaction costs ¹
Net interest (income) expense
Depreciation and amortization
Stock-based compensation expense²
Provision for income taxes
Foreign exchange (gains) / losses³
Tax receivable agreement liability adjustment4
Adjusted EBITDA
Less: Depreciation and amortization
Add: D&A related to acquisitions and the Refinitiv
Transaction 5
Adjusted EBIT
Add: Net interest income (expense)
Adjusted EBT
Adjusted EBITDA margin
Adjusted EBIT margin6
27
$
© 2022 Tradeweb Markets LLC. All rights reserved.
Successor Successor Successor Successor Successor Successor Predecessor Predecessor Predecessor
1Q21
FY21
4Q18
9M 18
130,160 $
26,830
1Q22
97,445 $
(18)
447
44,450
3,869
13,710
732
81,565
1,761
493
40,966
6,383
16,269
(5,353)
51.6%
47.5%
$ 273,108
5,073
1,590
171,308
16,509
96,875
52.0 %
47.8 %
FY20
316
153,789
13,025
56,074
(4,702)
(1,085)
6,279
(12,745) (11,425)
(33,134)
$ 160,635 $ 142,084 $ 547,016 $ 436,448 $ 353,162 $
(44,450) (40,966) (171,308) (153,789) (139,330)
31,769
29,603 124,580 110,187
97,565
50.8 %
46.5%
FY19
$ 218,390 $ 173,024 $ 29,307 $
$ 147,954 $ 130,721 $ 500,288 $ 392,846 $ 311,397 $
(447)
(493) (1,590)
(316)
2,373
$147,507 $ 130,228 $ 498,698 $ 392,530 $ 313,770 $
(2,373)
139,330
25,098
52,302
48.9 %
44.0 %
45.5%
40.2 %
(787)
33,020
3,415
353
65,308 $
(33,020)
22,413
54,701 $
787
55,488 $
36.6%
30.6 %
(1,726)
48,808
Tradeweb
11,900
(1,881)
2017
184,859 $
1,726
186,585 $
42.3 %
36.5%
83,648 $
58,520
(685)
68,615
6,129
(1,042)
214,091 $ 215,185 $
(68,615)
(48,808)
19,576
31,236
177,806 $
685
178,491 $
38.2 %
31.6%
2016
93,161
26,224
695
80,859
(725)
557
200,771
(80,859)
41,125
161,037
(695)
160,342
1. Represents transaction and other costs related to the NFI Acquisition, which closed in June 2021. Acquisition-related costs primarily include legal, consulting and advisory fees and severance costs incurred that relate to the acquisition transaction.
2. Represents non-cash stock-based compensation expense associated with the Special Option Award and post-IPO options awarded in 2019 and payroll taxes associated with exercises of such options and non-cash accelerated stock-based
compensation expense associated with our former CFO and our retiring CEO and related payroll taxes during the applicable periods.
3. Represents unrealized gain or loss recognized on foreign currency forward contracts and foreign exchange gain or loss from the revaluation of cash denominated in a different currency than the entity's functional currency.
4. Represents income recognized during the applicable period due to changes in the tax receivable agreement liability recorded in the statement of financial condition as a result of changes in the mix of earnings, tax legislation and tax rates in various
jurisdictions which impacted our tax savings.
5. Represents intangible asset and acquired software amortization resulting from the NFI Acquisition and intangible asset amortization and increased tangible asset and capitalized software depreciation and amortization resulting from the application of
pushdown accounting to the Refinitiv Transaction (where all assets were marked to fair value as of the closing date of the Refinitiv Transaction).
6. Adjusted EBITDA margin and Adjusted EBIT margin are defined as Adjusted EBITDA and Adjusted EBIT, respectively, divided by gross revenue for the applicable period. See "Strong & Broad-based Revenue and YTD Margin Expansion vs. FY21" for
gross revenue.
38.7 %
31.1 %View entire presentation