Alternus Energy SPAC Presentation Deck
CAPITAL EFFICIENT FINANCING STRATEGY RELEASES OPERATING CASH TO Operating Model Overview 24
REINVEST INTO NEW ASSETS
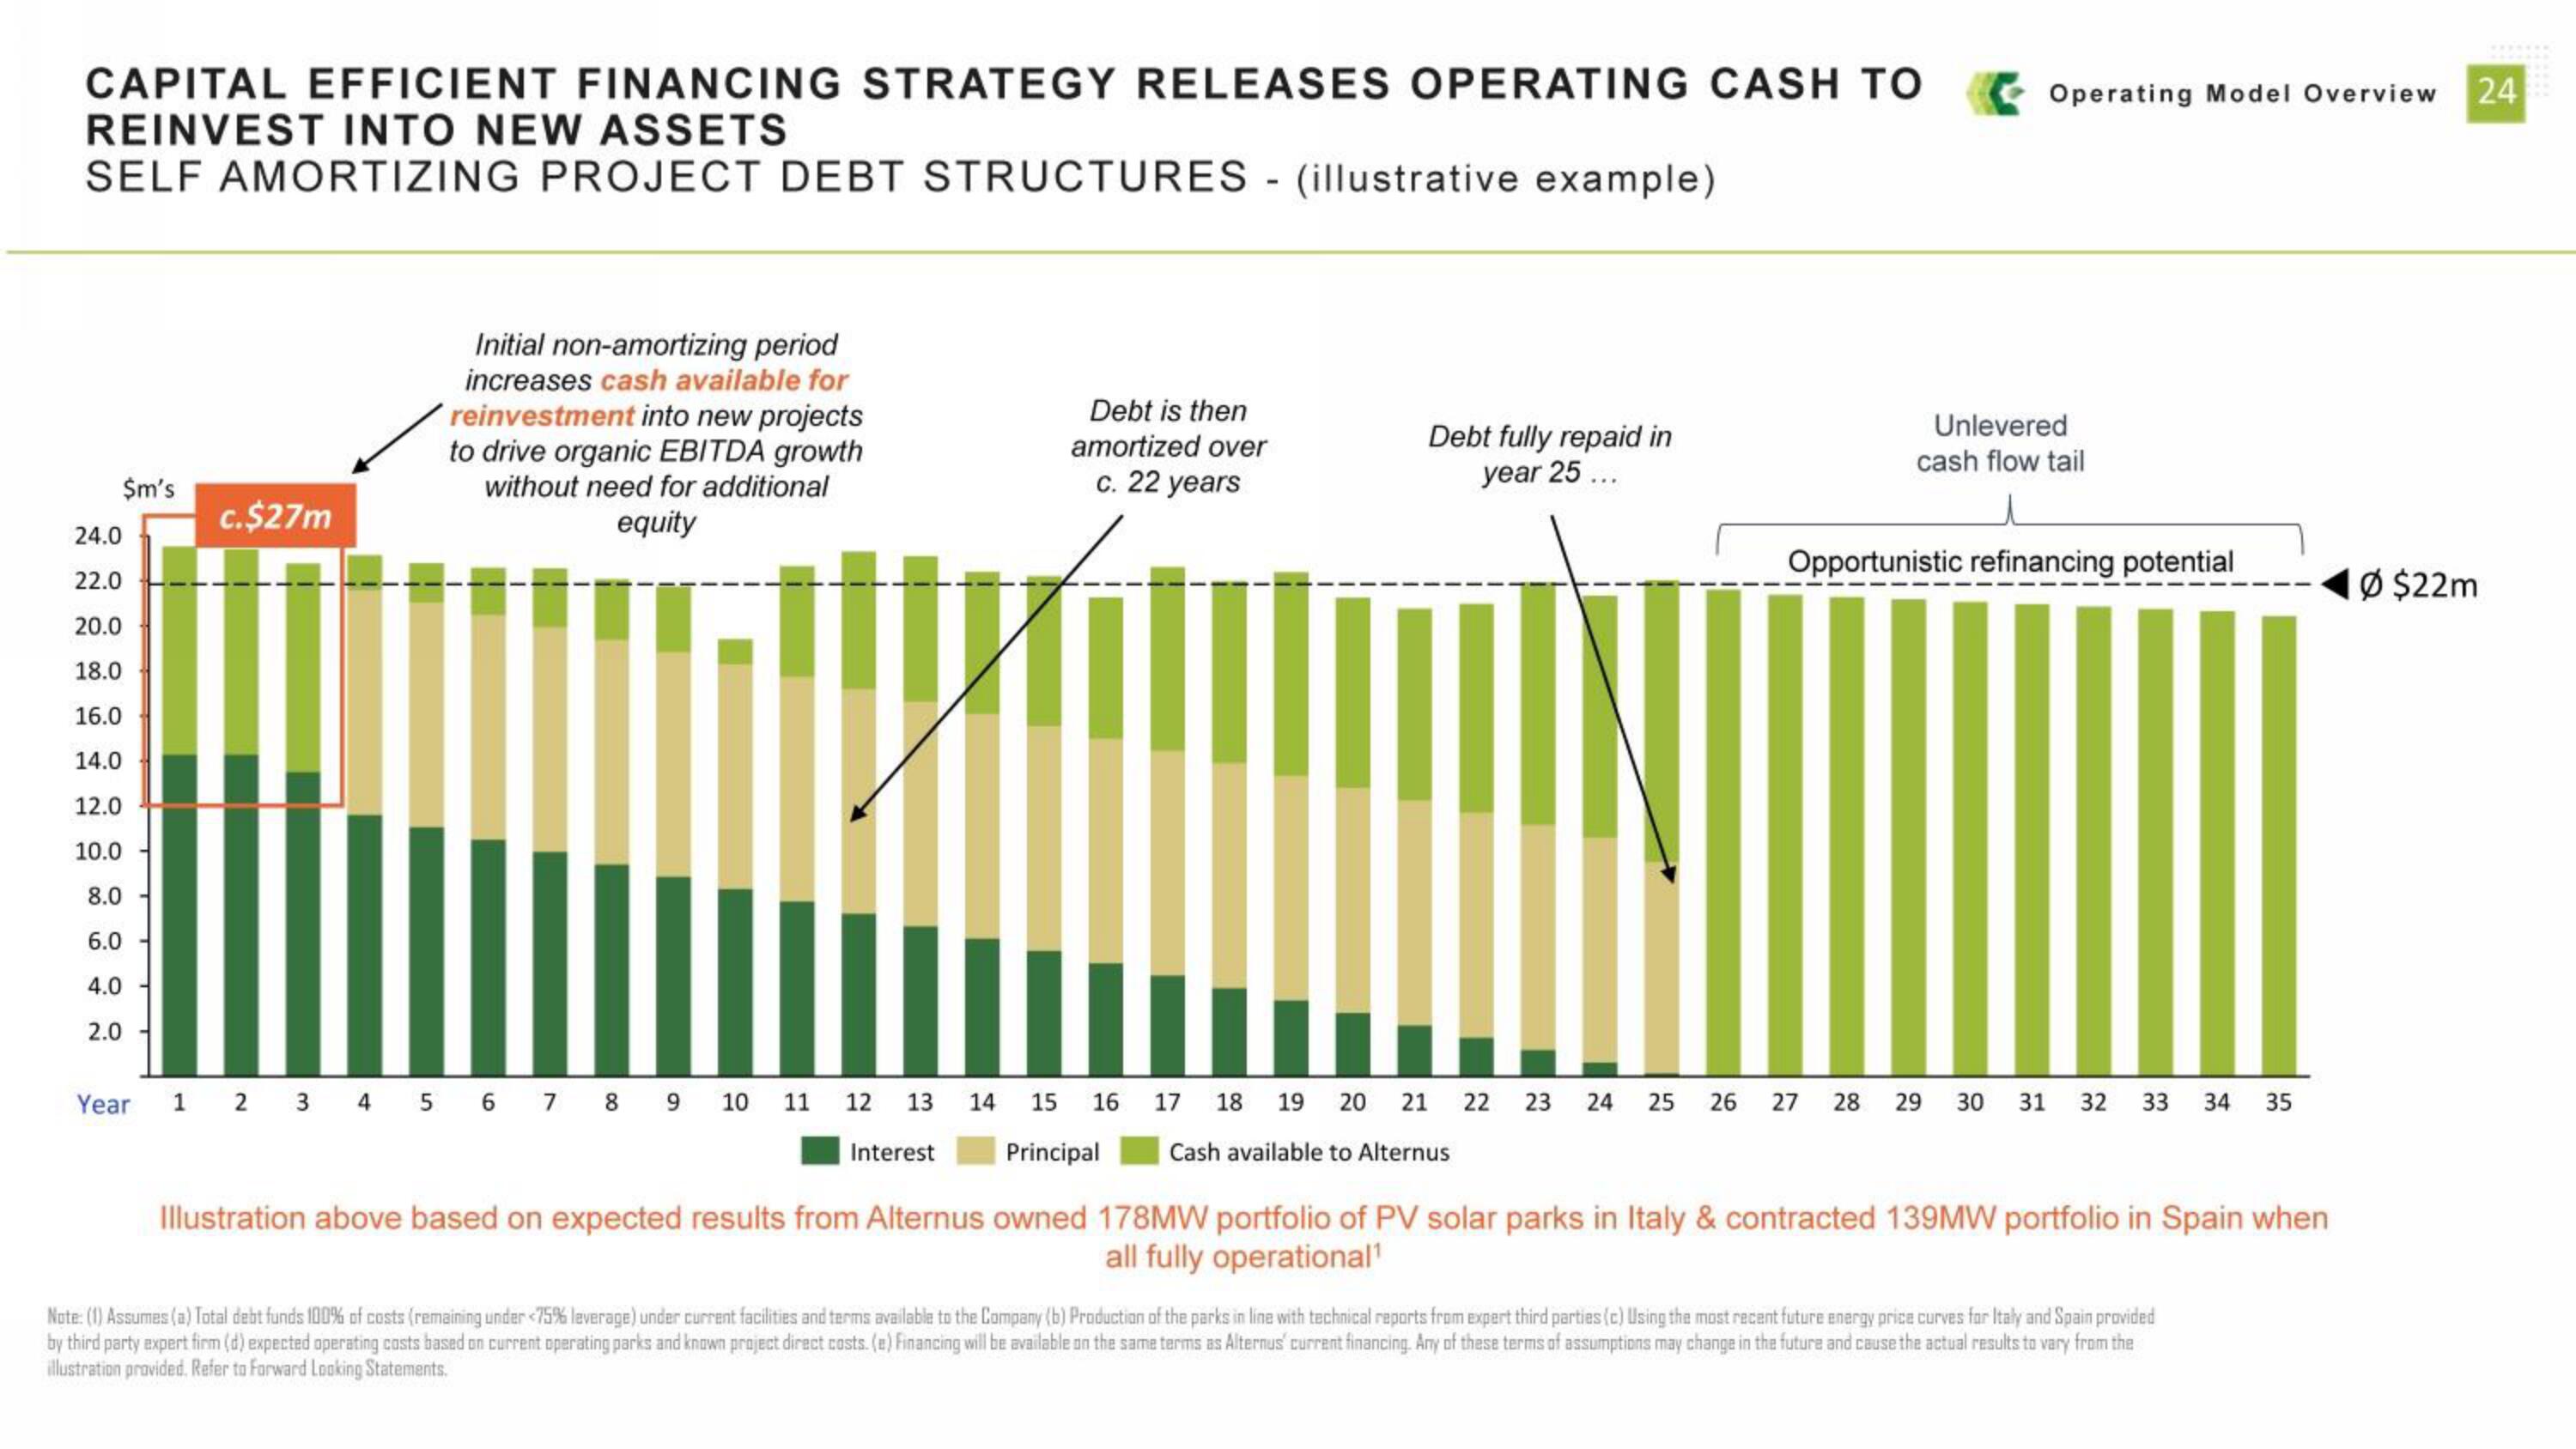
SELF AMORTIZING PROJECT DEBT STRUCTURES (illustrative example)
$m's
24.0
22.0
20.0
18.0
16.0
14.0
12.0
10.0
8.0
6.0
4.0
2.0
Year
c.$27m
Initial non-amortizing period
increases cash available for
reinvestment into new projects
to drive organic EBITDA growth
without need for additional
equity
1 2 3 4 5 6 7 8 9 10 11
12 13
Interest
-
Debt is then
amortized over
c. 22 years
14 15 16
Principal
Debt fully repaid in
year 25 ...
17 18 19 20 21 22 23 24
Cash available to Alternus
Opportunistic refinancing potential
25 26 27
Unlevered
cash flow tail
28
29 30 31 32 33 34 35
◄Ø $22m
Illustration above based on expected results from Alternus owned 178MW portfolio of PV solar parks in Italy & contracted 139MW portfolio in Spain when
all fully operational¹
Note: (1) Assumes (a) Total debt funds 100% of costs (remaining under <75% leverage) under current facilities and terms available to the Company (b) Production of the parks in line with technical reports from expert third parties (c) Using the most recent future energy price curves for Italy and Spain provided
by third party expert firm (d) expected operating costs based on current operating parks and known project direct costs. (e) Financing will be available on the same terms as Alternus' current financing. Any of these terms of assumptions may change in the future and cause the actual results to vary from the
illustration provided. Refer to Forward Looking Statements.View entire presentation