OpenText Results Presentation Deck
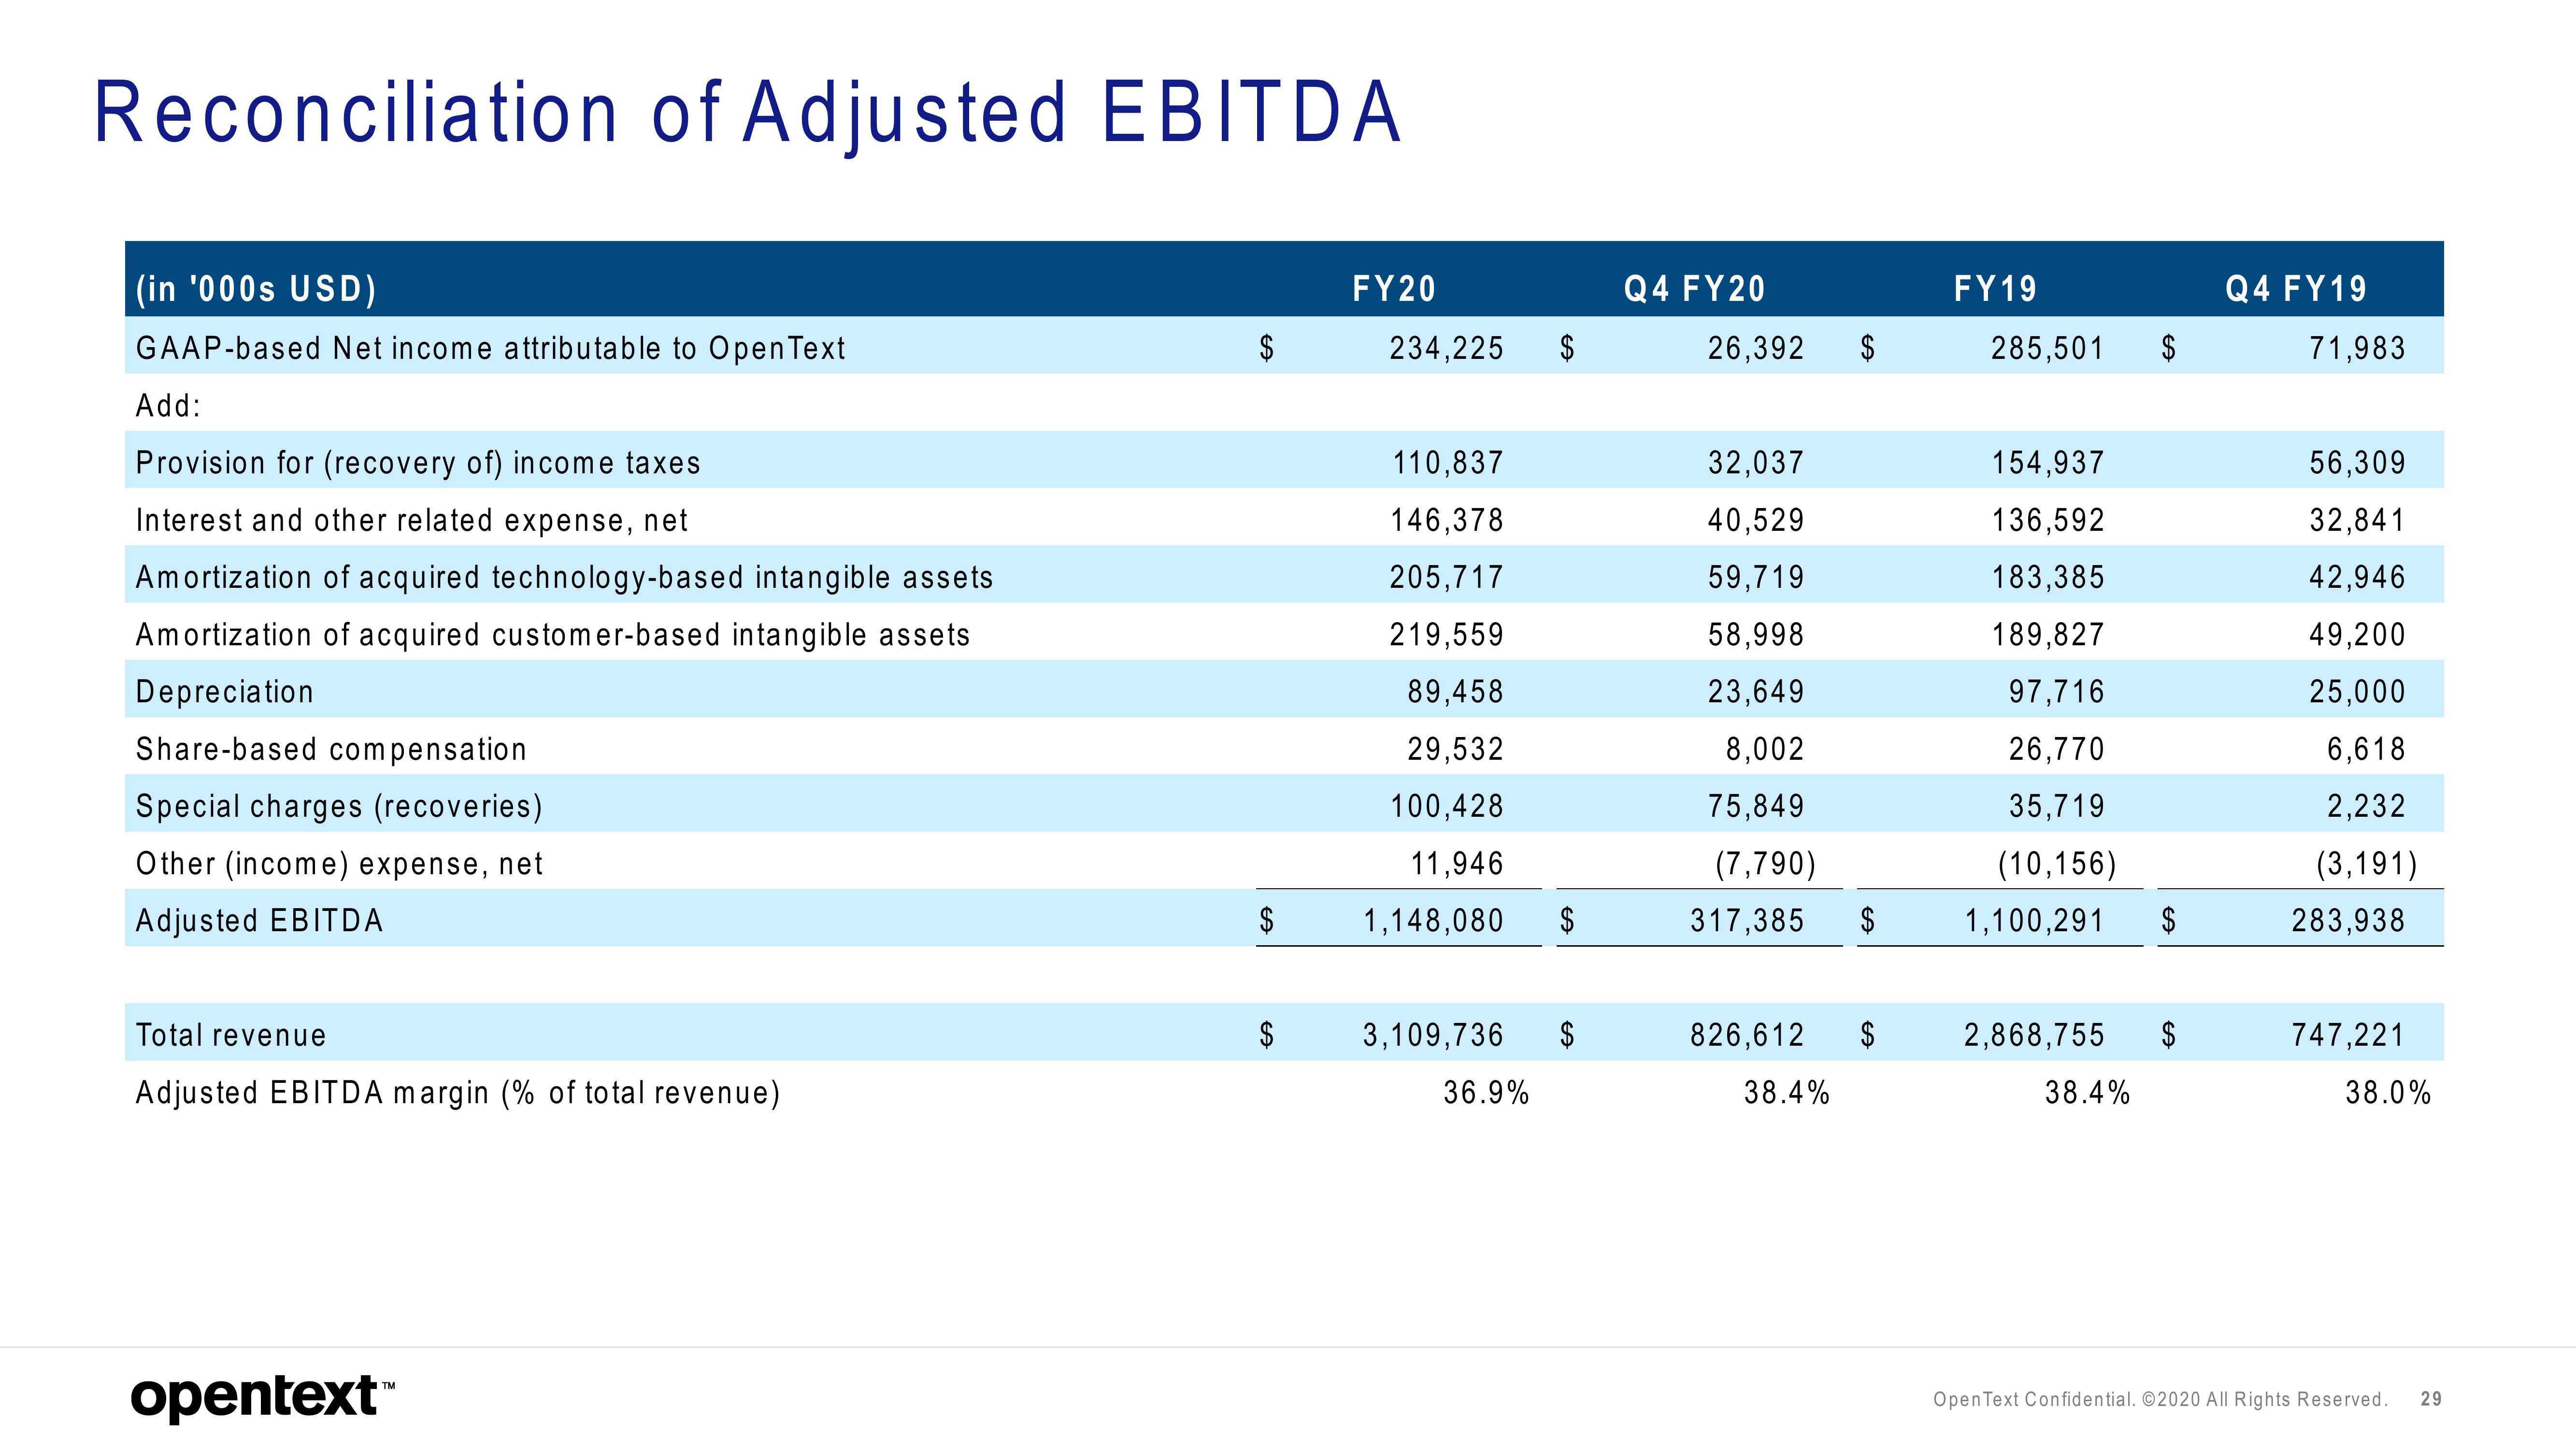
Reconciliation of Adjusted EBITDA
(in '000s USD)
GAAP-based Net income attributable to Open Text
Add:
Provision for (recovery of) income taxes
Interest and other related expense, net
Amortization of acquired technology-based intangible assets
Amortization of acquired customer-based intangible assets
Depreciation
Share-based compensation
Special charges (recoveries)
Other (income) expense, net
Adjusted EBITDA
Total revenue
Adjusted EBITDA margin (% of total revenue)
opentext™
$
$
$
FY20
234,225
110,837
146,378
205,717
219,559
89,458
29,532
100,428
11,946
1,148,080
3,109,736
36.9%
$
$
Q4 FY20
26,392
$
32,037
40,529
59,719
58,998
23,649
8,002
75,849
(7,790)
317,385 $
826,612 $
38.4%
FY19
285,501
154,937
136,592
183,385
189,827
97,716
26,770
35,719
(10,156)
1,100,291 $
2,868,755
$
38.4%
$
Q4 FY19
71,983
56,309
32,841
42,946
49,200
25,000
6,618
2,232
(3,191)
283,938
747,221
38.0%
Open Text Confidential. ©2020 All Rights Reserved. 29View entire presentation