Uber Results Presentation Deck
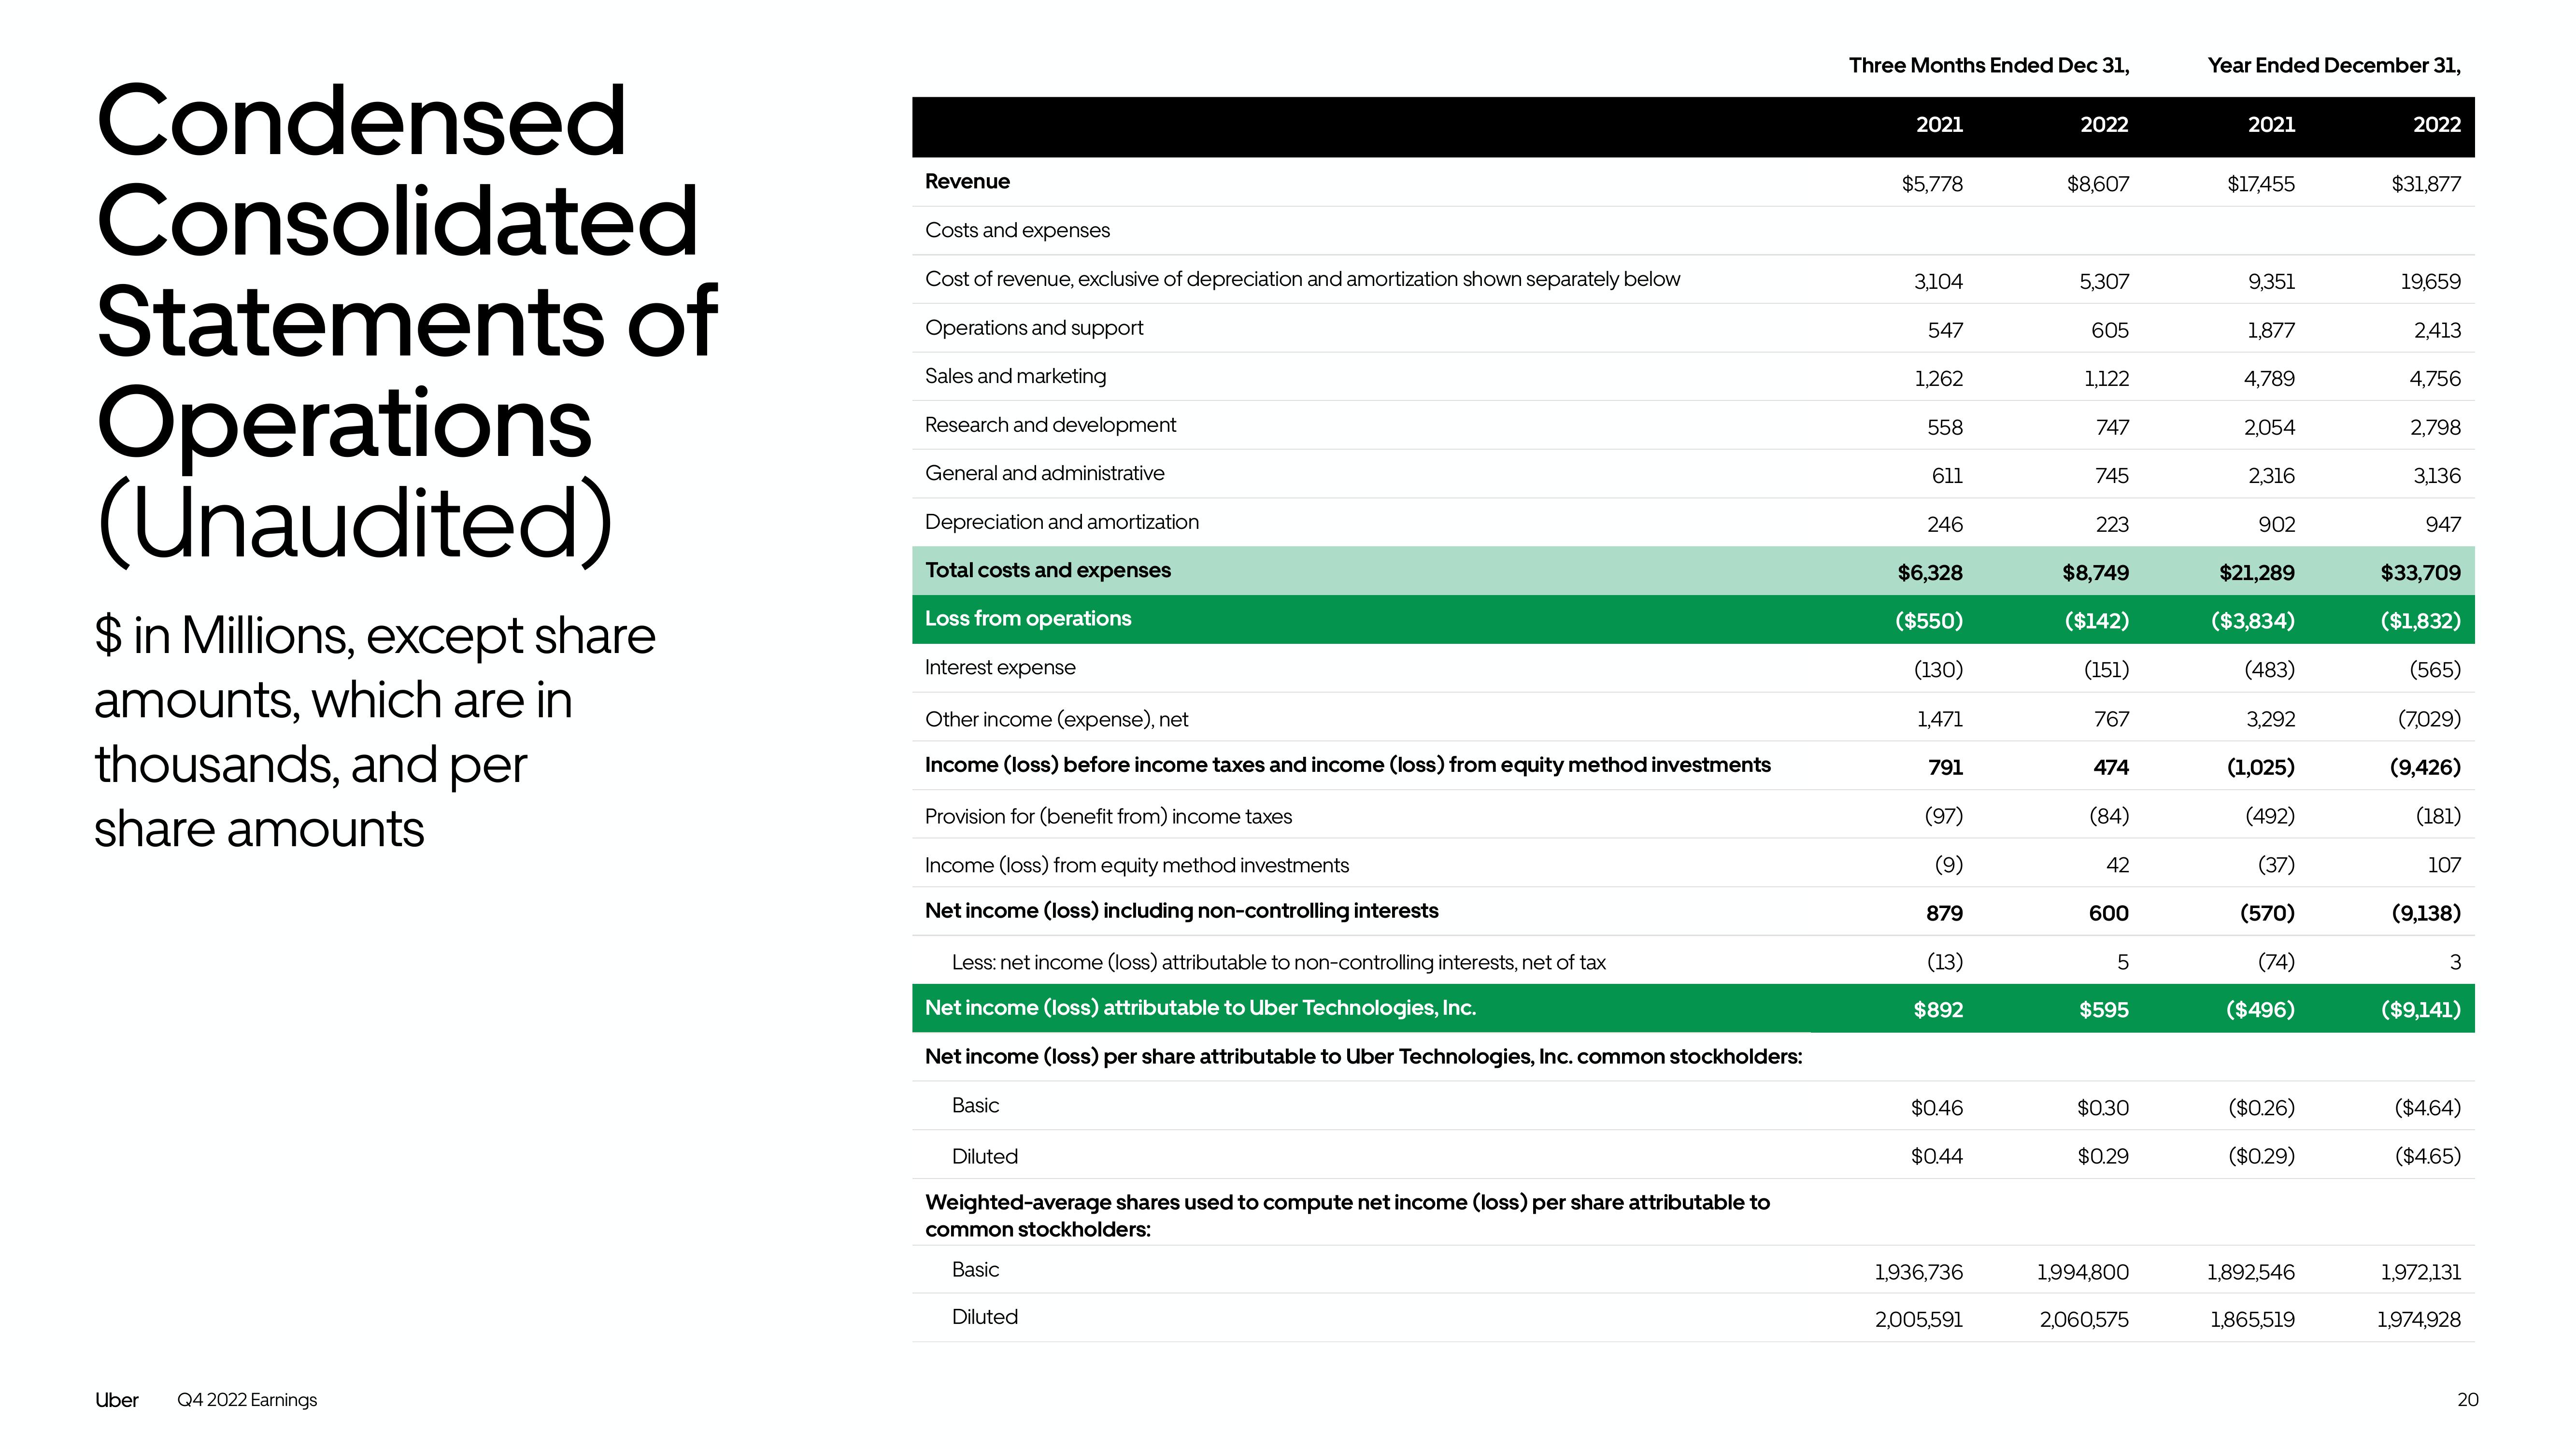
Condensed
Consolidated
Statements of
Operations
(Unaudited)
$ in Millions, except share
amounts, which are in
thousands, and per
share amounts
Uber Q4 2022 Earnings
Revenue
Costs and expenses
Cost of revenue, exclusive of depreciation and amortization shown separately below
Operations and support
Sales and marketing
Research and development
General and administrative
Depreciation and amortization
Total costs and expenses
Loss from operations
Interest expense
Other income (expense), net
Income (loss) before income taxes and income (loss) from equity method investments
Provision for (benefit from) income taxes
Income (loss) from equity method investments
Net income (loss) including non-controlling interests
Less: net income (loss) attributable to non-controlling interests, net of tax
Net income (loss) attributable to Uber Technologies, Inc.
Net income (loss) per share attributable to Uber Technologies, Inc. common stockholders:
Basic
Diluted
Weighted-average shares used to compute net income (loss) per share attributable to
common stockholders:
Basic
Diluted
Three Months Ended Dec 31,
2021
$5,778
3,104
547
1,262
558
611
246
$6,328
($550)
(130)
1,471
791
(97)
(9)
879
(13)
$892
$0.46
$0.44
1,936,736
2,005,591
2022
$8,607
5,307
605
1,122
747
745
223
$8,749
($142)
(151)
767
474
(84)
42
600
5
$595
$0.30
$0.29
1,994,800
2,060,575
Year Ended December 31,
2021
$17,455
9,351
1,877
4,789
2,054
2,316
902
$21,289
($3,834)
(483)
3,292
(1,025)
(492)
(37)
(570)
(74)
($496)
($0.26)
($0.29)
1,892,546
1,865,519
2022
$31,877
19,659
2,413
4,756
2,798
3,136
947
$33,709
($1,832)
(565)
(7,029)
(9,426)
(181)
107
(9,138)
3
($9,141)
($4.64)
($4.65)
1,972,131
1,974,928
20View entire presentation