Antero Midstream Partners Investor Presentation Deck
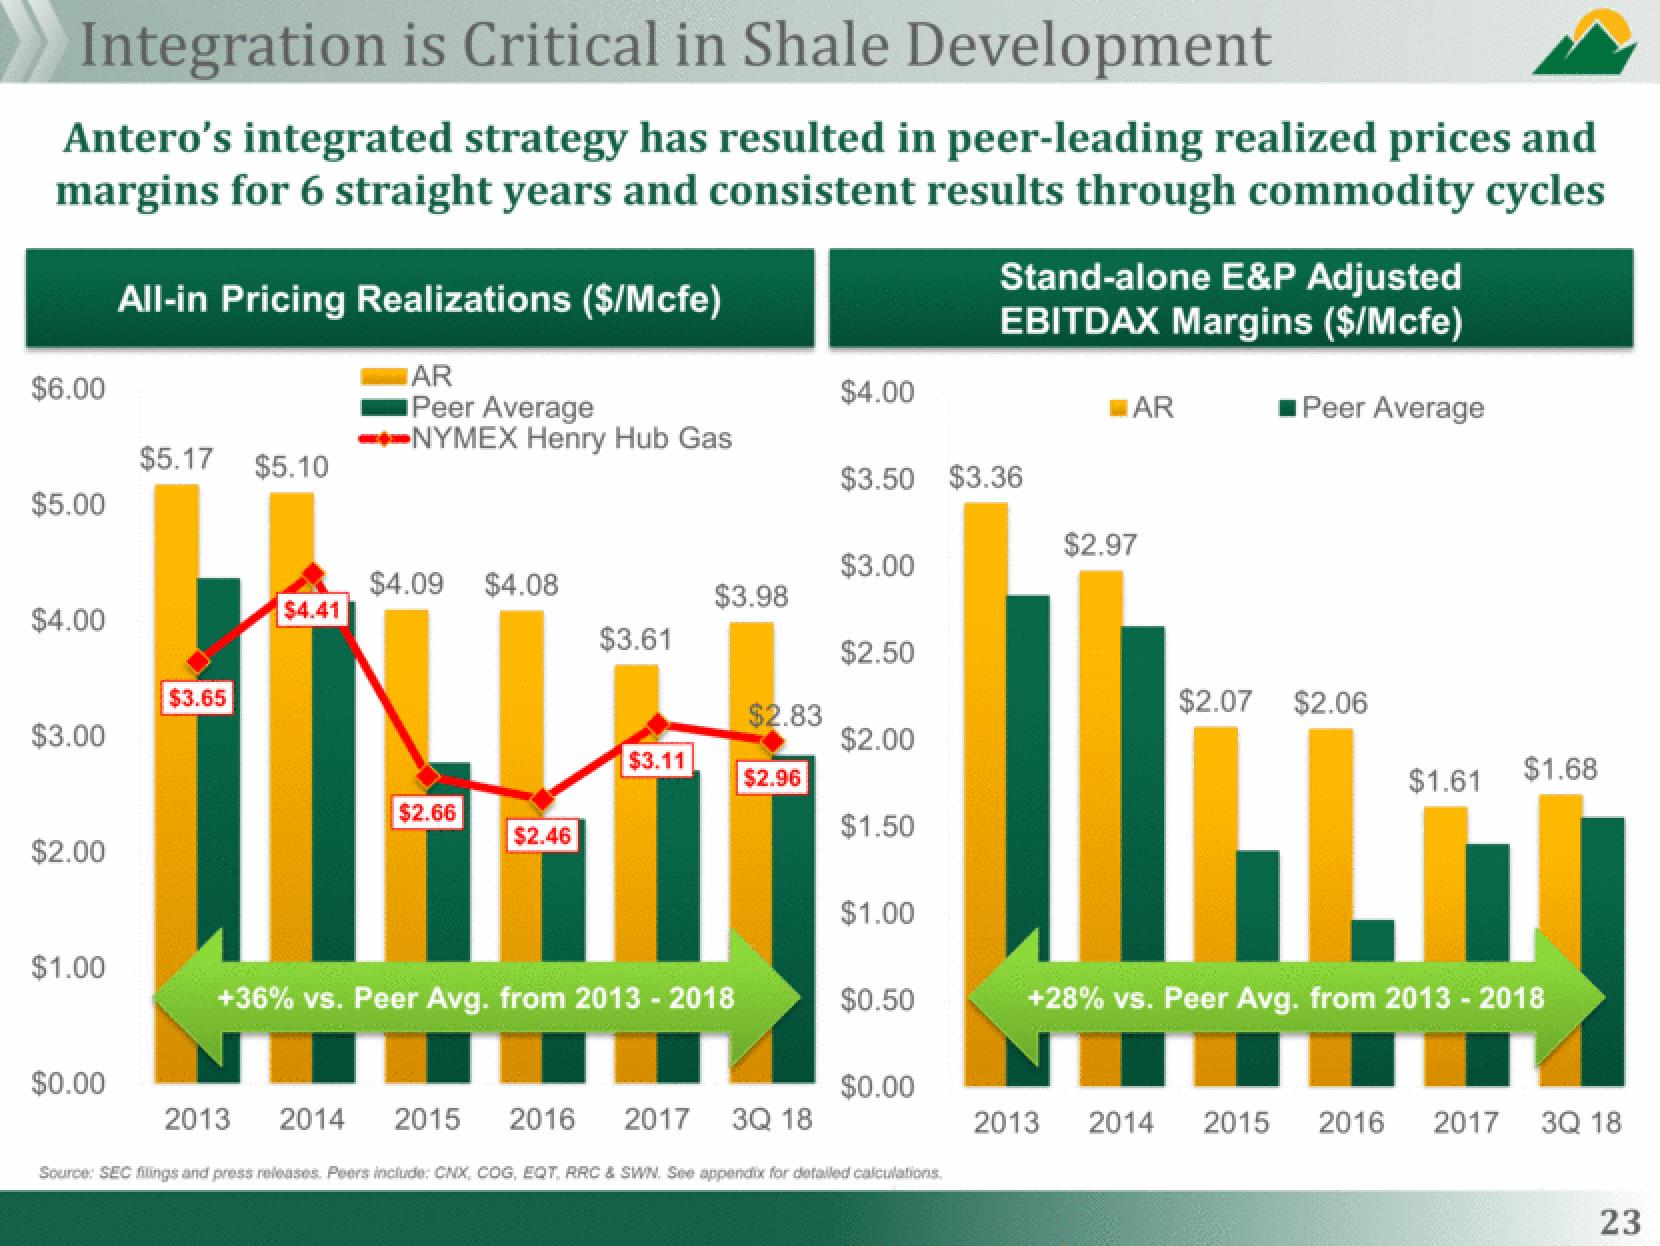
Integration is Critical in Shale Development
Antero's integrated strategy has resulted in peer-leading realized prices and
margins for 6 straight years and consistent results through commodity cycles
$6.00
$5.00
$4.00
$3.00
$2.00
$1.00
$0.00
All-in Pricing Realizations ($/Mcfe)
AR
Peer Average
NYMEX Henry Hub Gas
$5.17 $5.10
$4.09 $4.08
$4.41
|
NU
$3.65
2013
$2.66
$2.46
$3.61
$3.11
$3.98
+36% vs. Peer Avg. from 2013 - 2018
$2.83
$2.96
2014 2015 2016 2017 3Q 18
$4.00
$3.50 $3.36
$3.00
$2.50
$2.00
$1.50
$1.00
$0.50
$0.00
Stand-alone E&P Adjusted
EBITDAX Margins ($/Mcfe)
Source: SEC filings and press releases. Peers include: CNX, COG, EQT, RRC & SWN. See appendix for detailed calculations.
AR
$2.97
Peer Average
$2.07 $2.06
$1.61 $1.68
+28% vs. Peer Avg. from 2013 - 2018
2013 2014 2015 2016 2017
3Q 18
23View entire presentation