Nexters Results Presentation Deck
Key operating highlights
'000 users
Monthly Paying Users (¹)
8
395
Q2 2021
357
H1 2021
-13%
+1%
343
Q2 2022
359
HT 2022
$/month
Average Bookings Per Paying User (2)
125
Q2 2021
120
H1 2021
-17%
-12%
103
Q2 2022
106
HT 2022
$m
Bookings
154
Q2 2021
267
H1 2021
-28%
-11%
111
Q2 2022
238
HT 2022
Source: Company information (unaudited)
The Company defines Monthly Paying Users, or MPUS, as the number of individuals who made a purchase of a virtual item at least once on a particular platform in the 30-day period ending with the measurement
date; Quarterly MPU is the average of MPUS for each month for the respective quarter
(1)
(2)
The Company defines Average Bookings Per Paying User, or ABPPU, as its total Bookings attributable to in-game purchases in a given period, divided by the number of months in that period, divided by the average
number of MPUS during the period
nexters
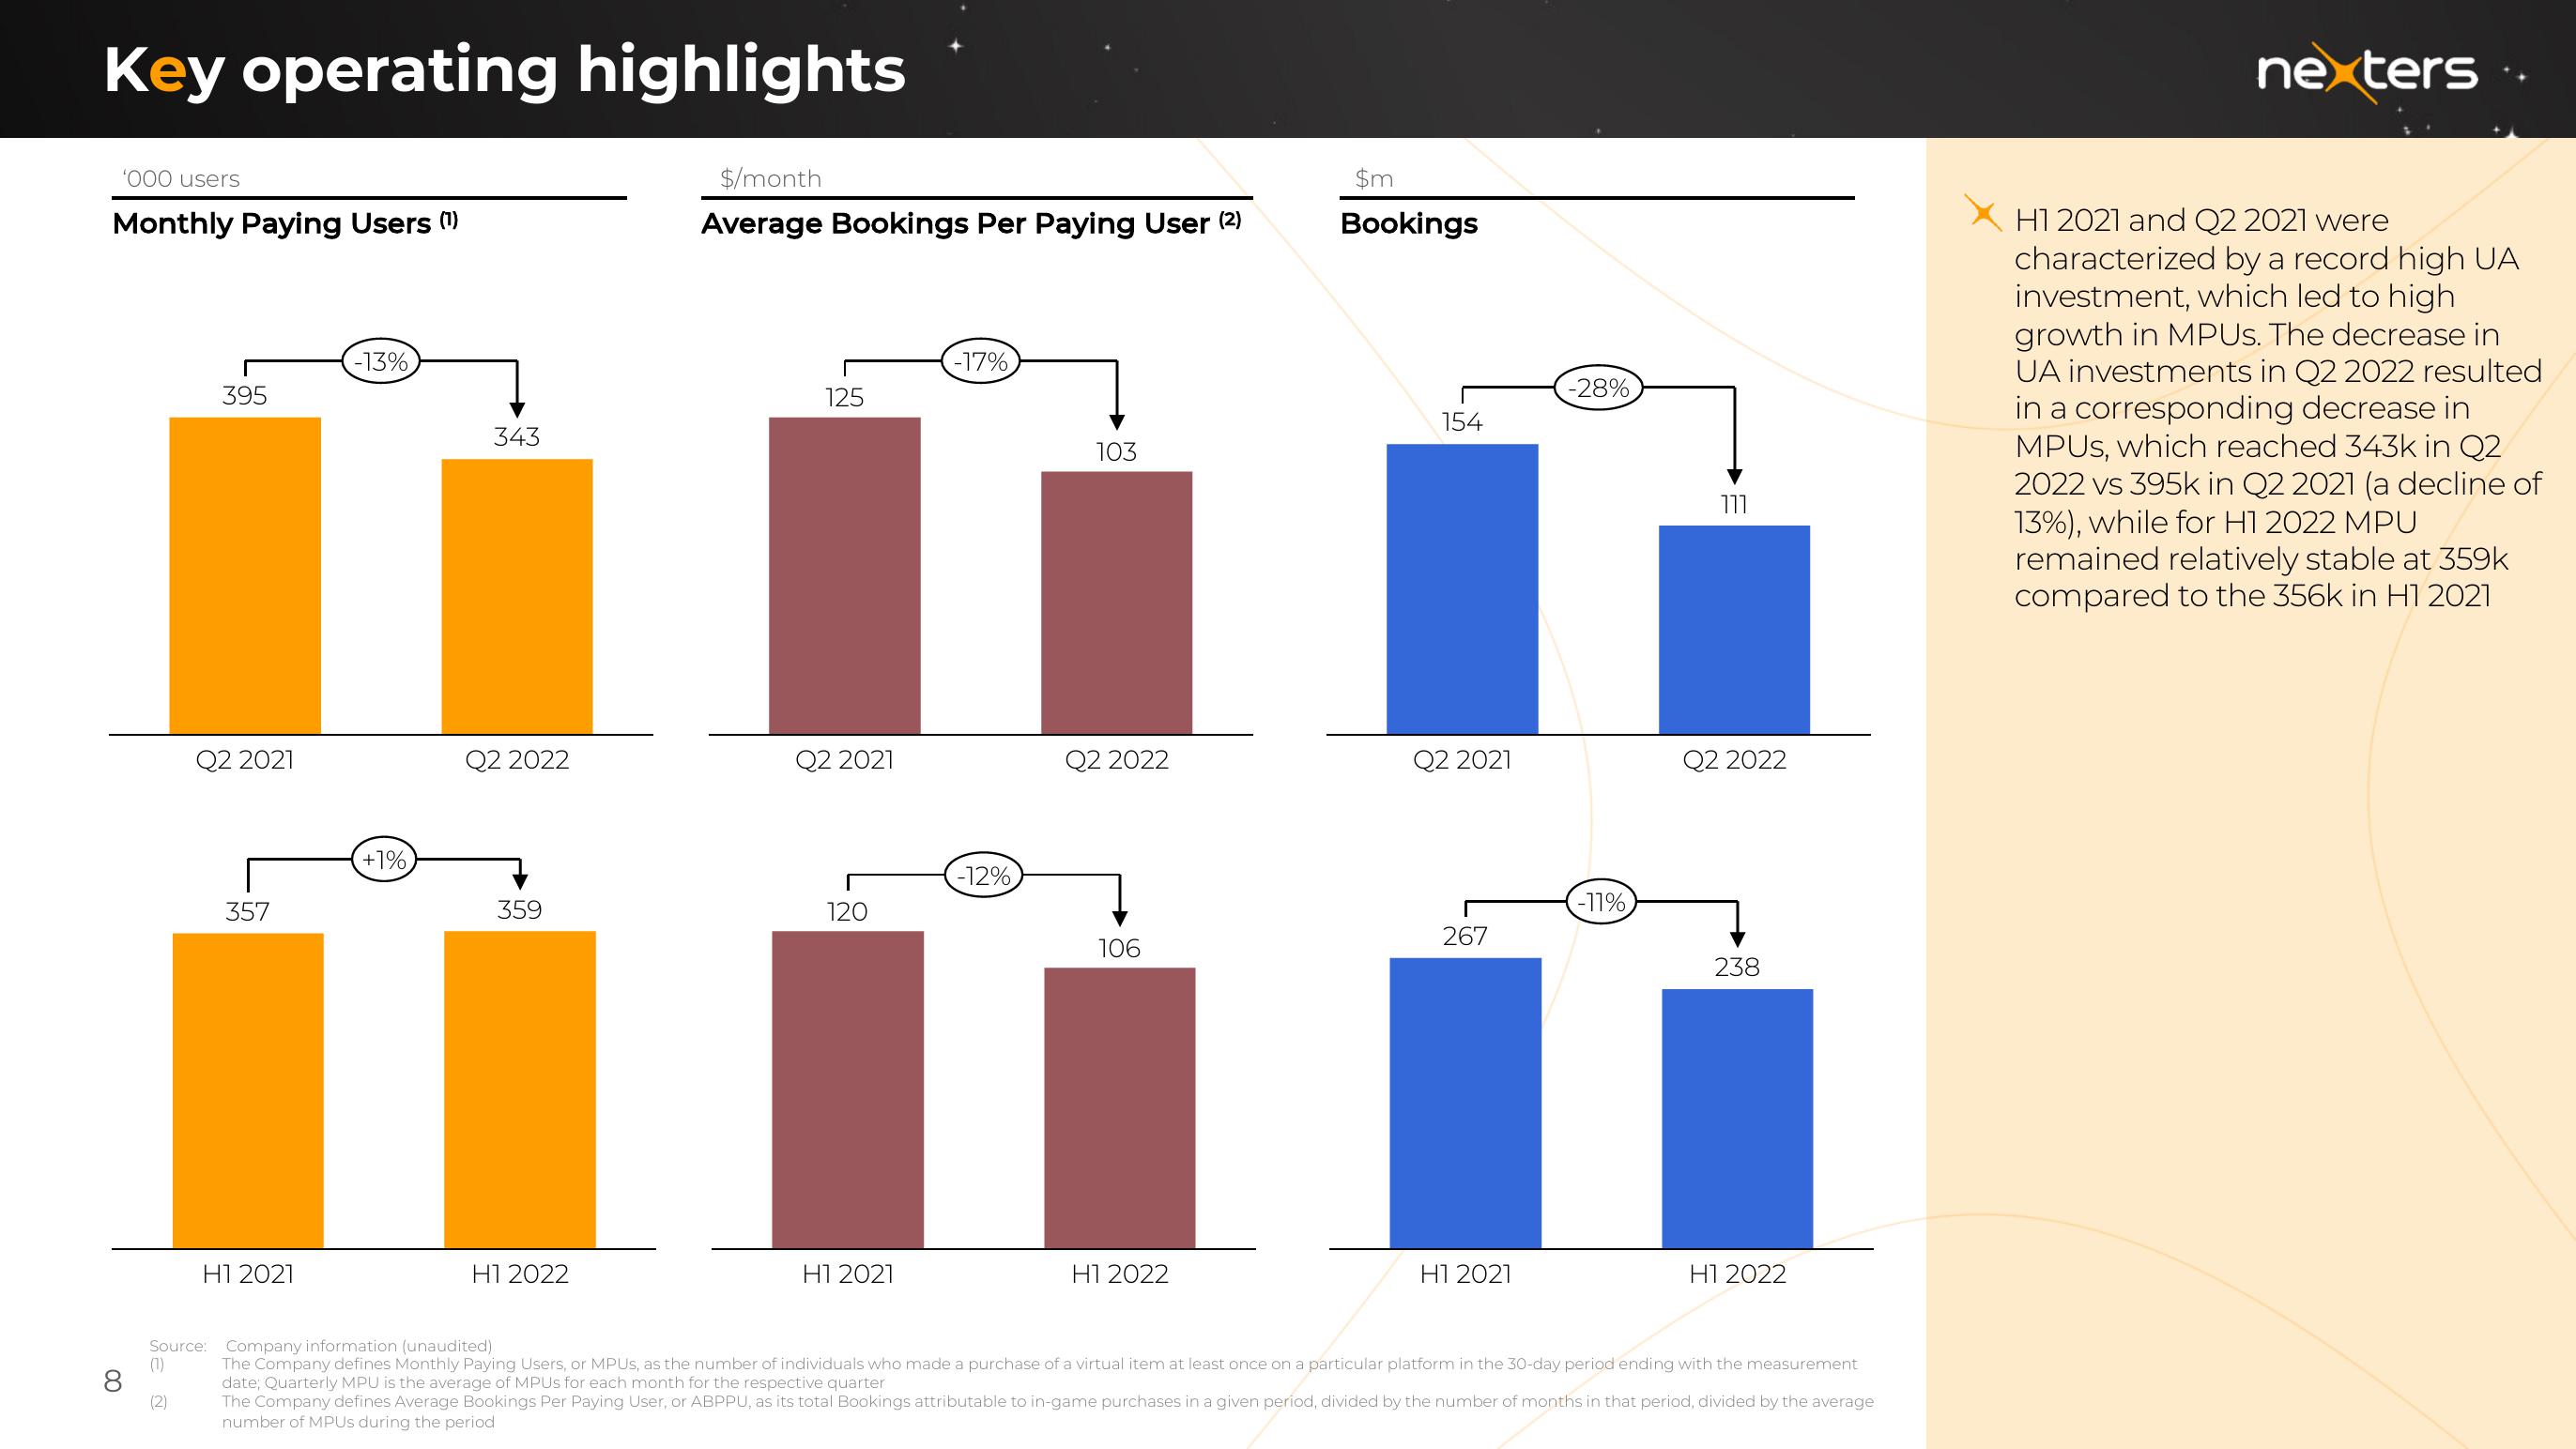
H1 2021 and Q2 2021 were
characterized by a record high UA
investment, which led to high
growth in MPUs. The decrease in
UA investments in Q2 2022 resulted
in a corresponding decrease in
MPUS, which reached 343k in Q2
2022 vs 395k in Q2 2021 (a decline of
13%), while for H1 2022 MPU
remained relatively stable at 359k
compared to the 356k in H1 2021View entire presentation