Barclays Investment Banking Pitch Book
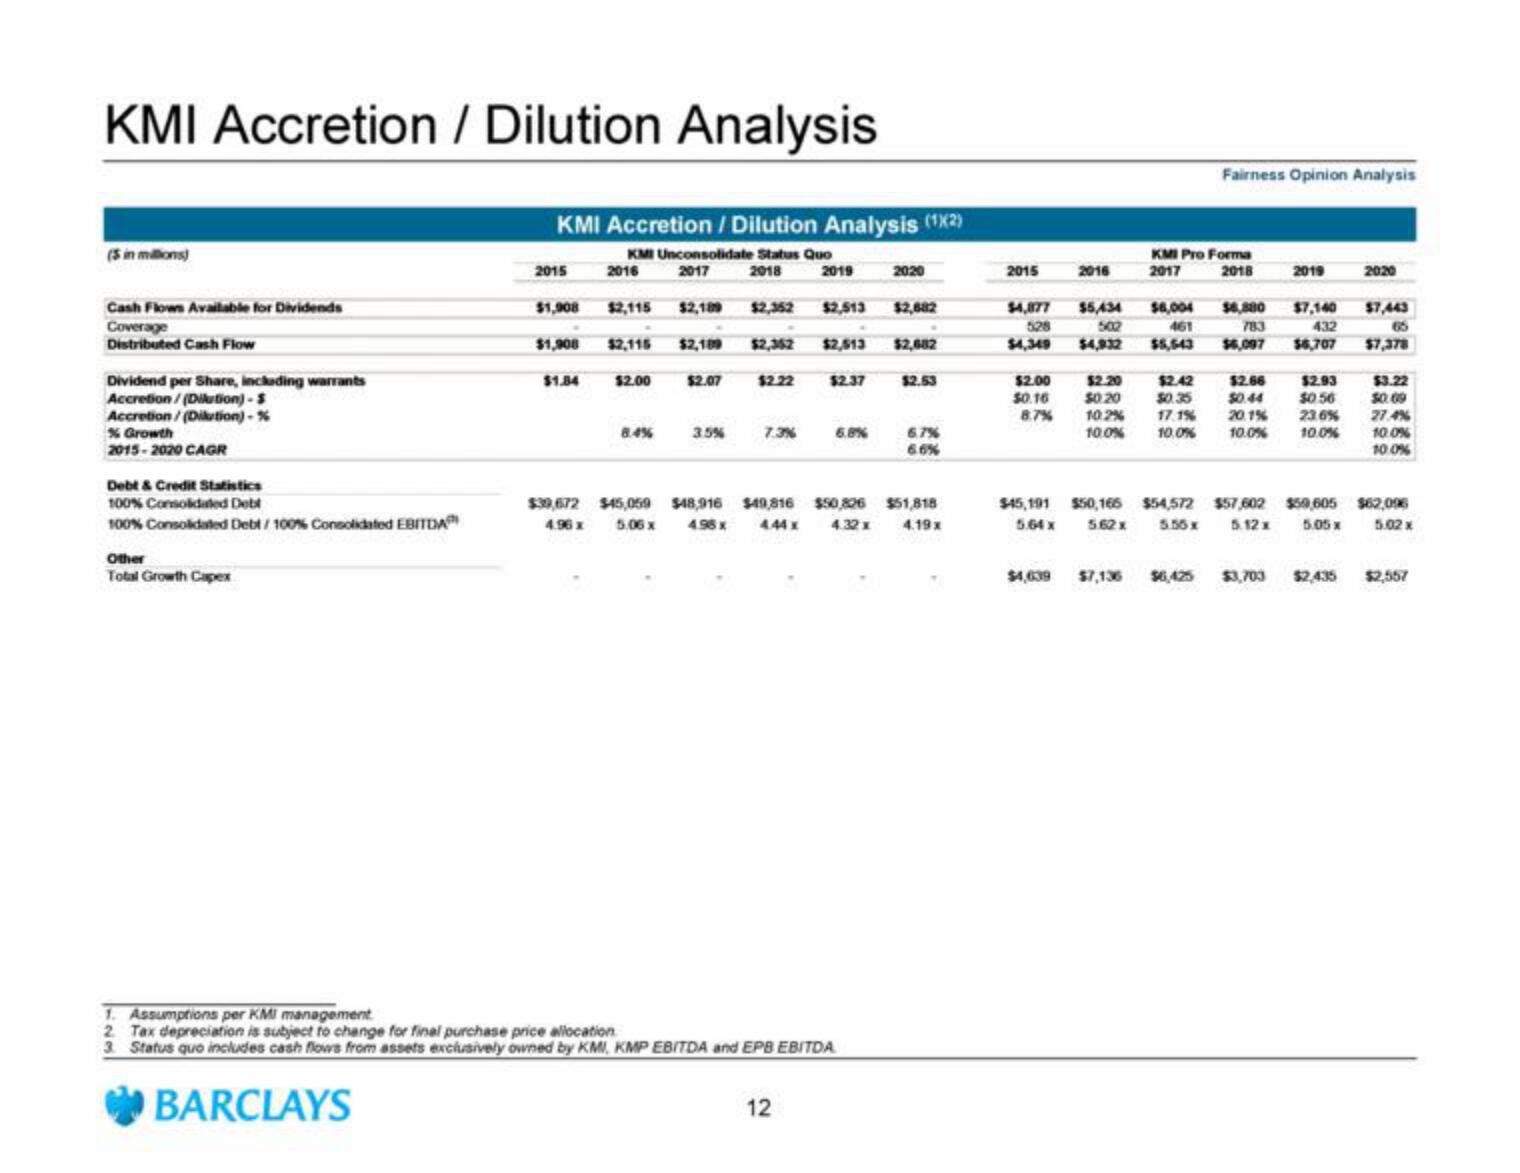
KMI Accretion / Dilution Analysis
(5 in millions)
Cash Flows Available for Dividends
Coverage
Distributed Cash Flow
Dividend per Share, including warrants
Accretion/(Dilution)-$
Accretion/(Dilution) -%
% Growth
2015-2020 CAGR
Debt & Credit Statistics
100% Consolidated Debt
100% Consolidated Debt / 100% Consolidated EBITDA
Other
Total Growth Capex
KMI Accretion/Dilution Analysis (12)
KMI Unconsolidate Status Quo
2017
2018
BARCLAYS
2015
$1,908
$1,908
$1.84
2016
$2,115
$2,115 $2,109
$2.00
8.4%
$39,672 $45,059
4.96 x
5.06 x
$2,189 $2,352 $2,513 $2,682
$2,352 $2,513 $2,682
$2.07
3.5%
$48,916
4.98 x
$2.22
7.3%
2019
$2.37
12
6.8%
1. Assumptions per KMI management
2 Tax depreciation is subject to change for final purchase price allocation
3. Status quo includes cash flows from assets exclusively owned by KMI, KMP EBITDA and EPB EBITDA
2020
$2.53
$49,816 $50,826 $51,818
4.44 x 4.32 x 4.19x
6.7%
6.6%
2015
2016
$2.00
$0.16
8.7%
$2.20
$0.20
$4,877 $5,434 $6,004 $6,880 $7,140
528
502
461
783
432
$4,349 $4,932 $5,543 $6,097 $6,707
10.2%
10.0%
KMI Pro Forma
2017
2018
$4,639 $7,136
$2.42
$0.35
Fairness Opinion Analysis
17.1%
10.0%
$6,425
2019
$2.66
$2.93
$0.56
23.6%
20.1%
10.0% 10.0%
2020
$45,191 $50,166 $54,572 $57,602 $59,605 $62,096
5.64 x 562x 5.55x 5.12x 5.05x
5.02 x
$3,703 $2,435
$7,443
65
$7,378
$3.22
$0.09
27.4%
10.0%
10.0%
$2,557View entire presentation