Genelux Investor Presentation Deck
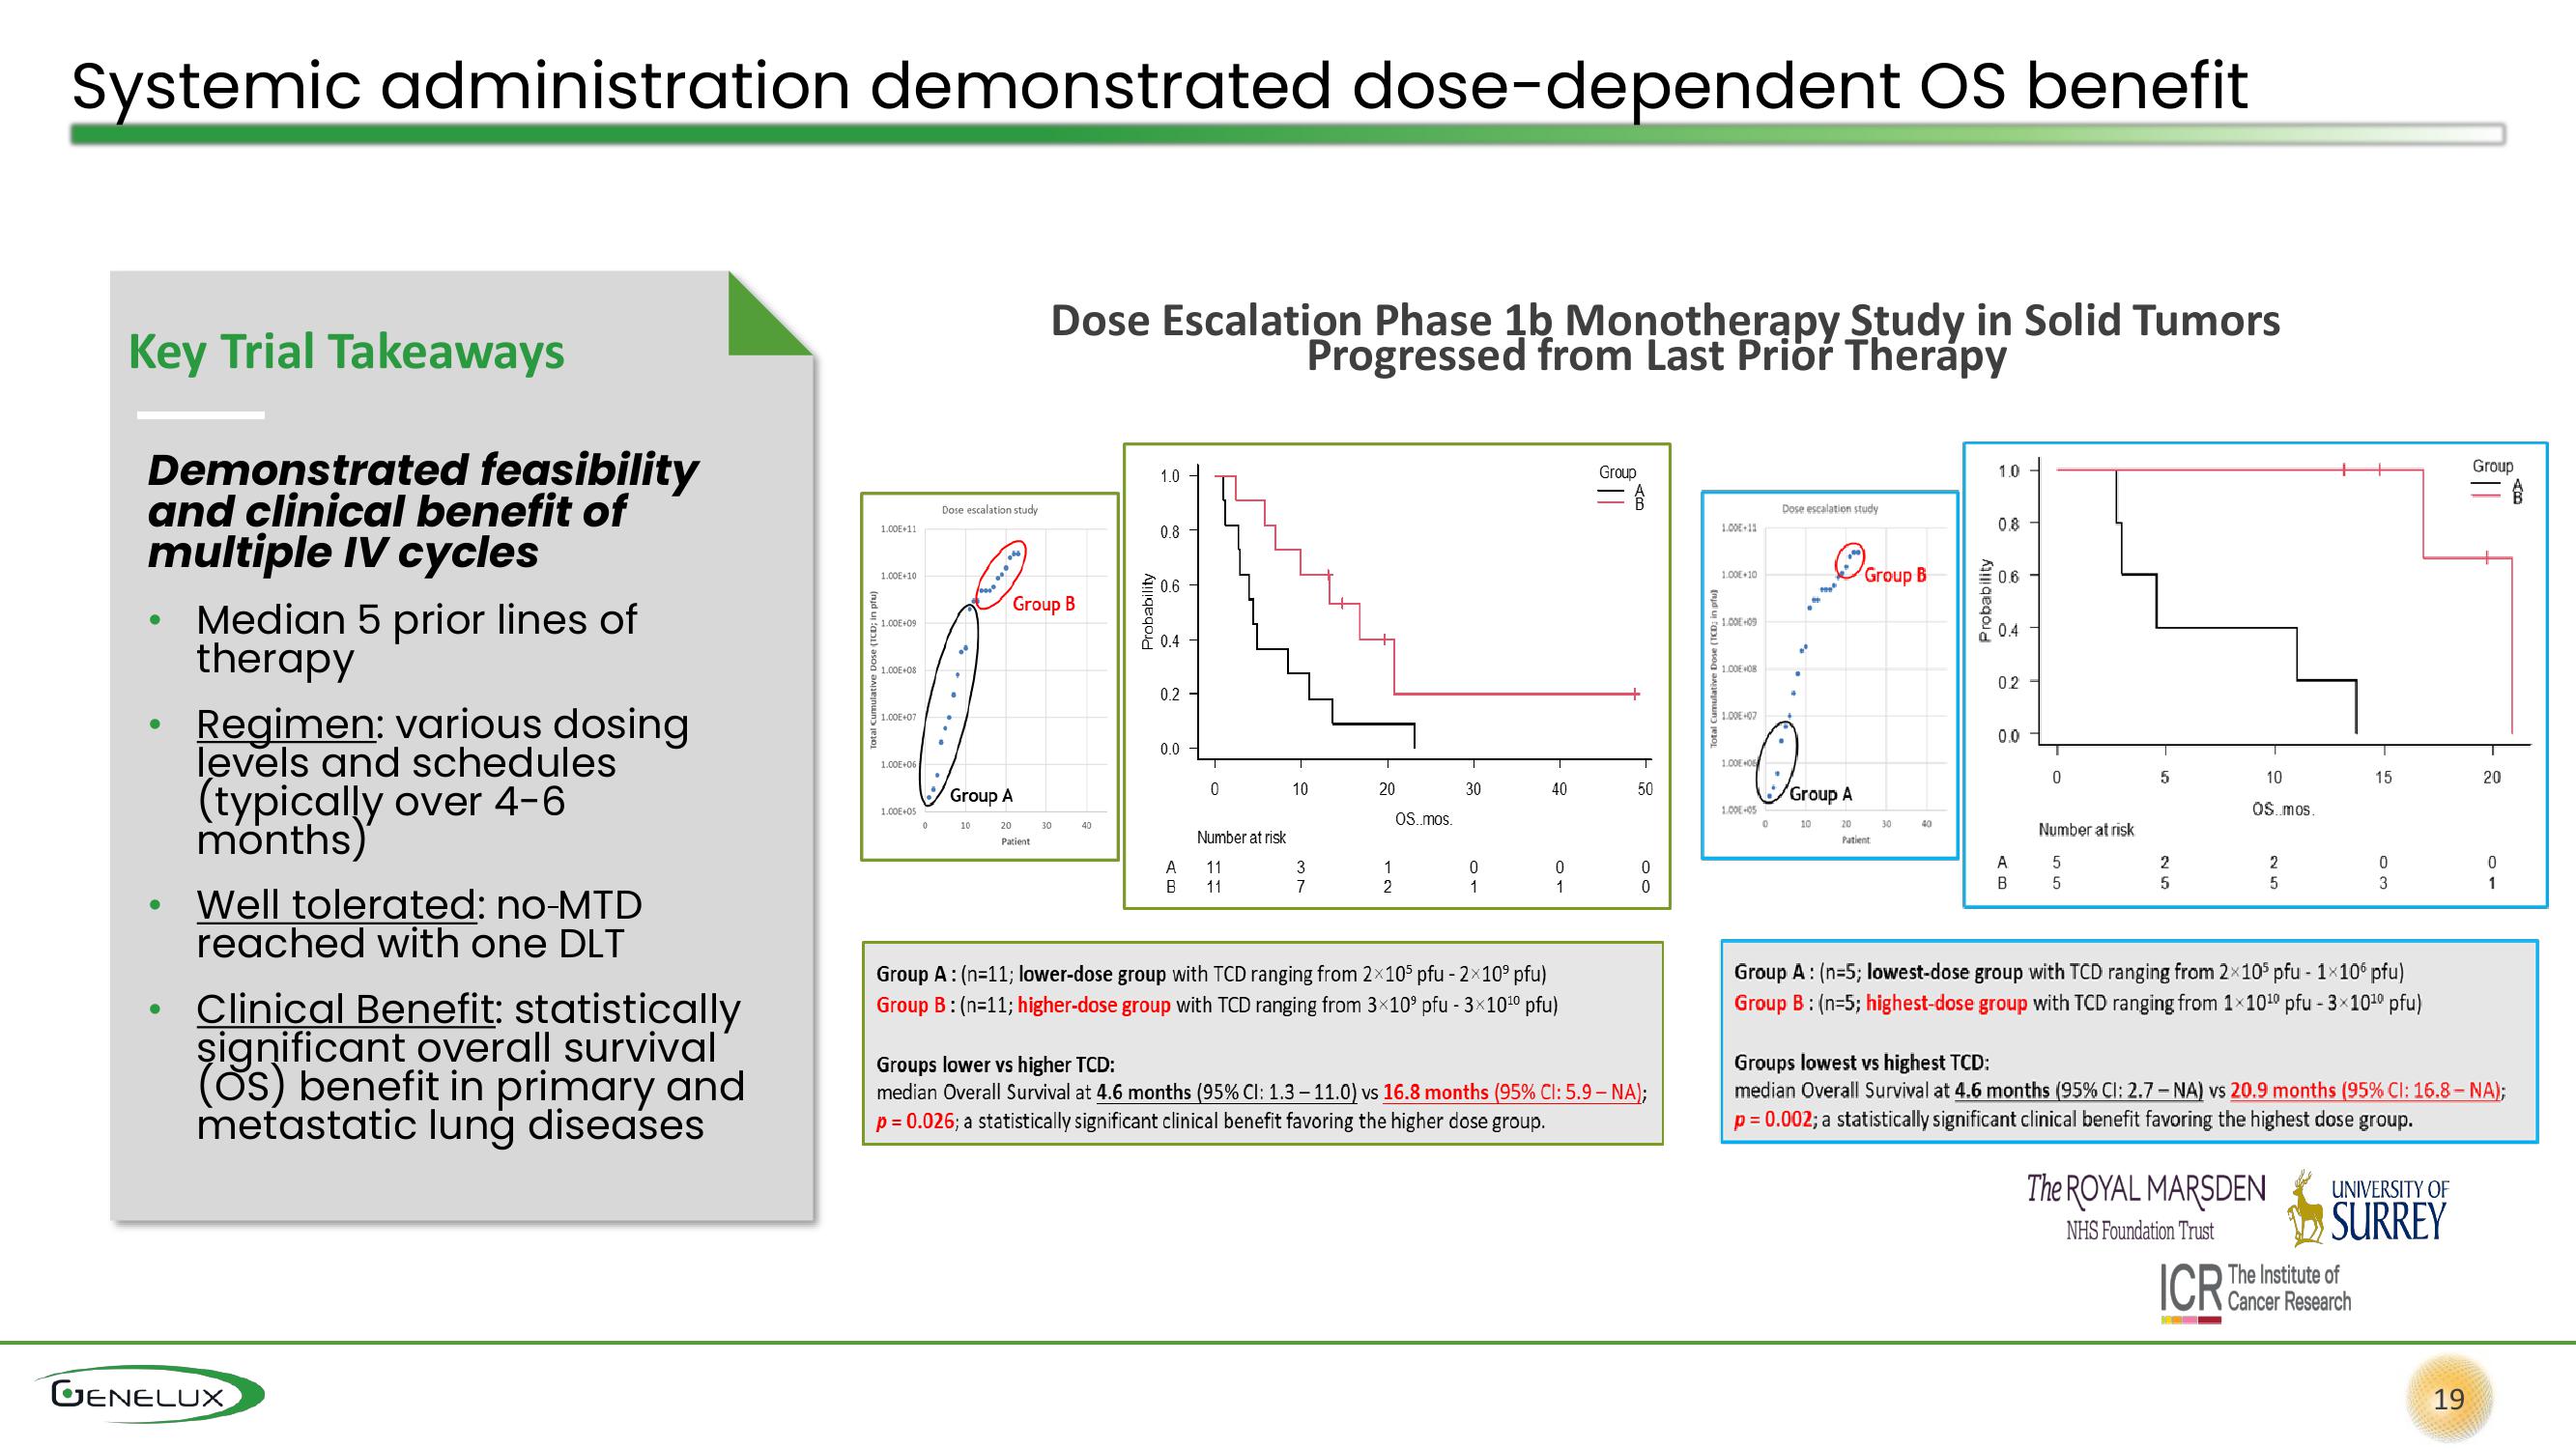
Systemic administration demonstrated dose-dependent OS benefit
Key Trial Takeaways
Demonstrated feasibility
and clinical benefit of
multiple IV cycles
●
●
Median 5 prior lines of
therapy
Regimen: various dosing
levels and schedules
(typically over 4-6
months)
Well tolerated: no-MTD
reached with one DLT
Clinical Benefit: statistically
significant overall survival
(OS) benefit in primary and
metastatic lung diseases
GENELUX
otal Cumulative Dose (TCD; in pfu)
1.00E+11
1.00E+10
1.00E+09
1.00E+08
1.00E+07
1.00E+06
1.00E+05
Dose escalation study
.
3.0***
10
Group A
Group B
20
Patient
Dose Escalation Phase 1b Monotherapy Study in Solid Tumors
Progressed from Last Prior Therapy
30
40
Probability
1.0
0.8
0.6
0.4
0.2
0.0
A
B
0
Number at risk
11
11
10
3
7
20
1
72
2
OS..mos.
30
0
1
40
0
1
Group A: (n=11; lower-dose group with TCD ranging from 2x10⁵ pfu - 2×10⁹ pfu)
Group B: (n=11; higher-dose group with TCD ranging from 3×10⁹ pfu - 3×10¹⁰ pfu)
Group
B
B
50
0
0
Groups lower vs higher TCD:
median Overall Survival at 4.6 months (95% CI: 1.3 -11.0) vs 16.8 months (95% CI: 5.9-NA);
p = 0.026; a statistically significant clinical benefit favoring the higher dose group.
1.00E+11
1.00E+10
1.00E+09
1.00E+08
1.00E+07
1.00E+0
1.00E+05
Dose escalation study
14
"
too
O
Group A
10
20
Patient
Group B 06
30
1.0
40
0.8
0.4
02
0.0
A
B
0
Number at risk
5
сл сл
5
5
2
5
10
OS mos.
51 52
The ROYAL MARSDEN
NHS Foundation Trust
ICR
2
Group A: (n=5; lowest-dose group with TCD ranging from 2×10⁵ pfu - 1×10⁶ pfu)
Group B: (n=5; highest-dose group with TCD ranging from 1×10¹0 pfu - 3×10¹0 pfu)
15
0
3
The Institute of
UNIVERSITY OF
SURREY
Groups lowest vs highest TCD:
median Overall Survival at 4.6 months (95% CI: 2.7 - NA) vs 20.9 months (95% CI: 16.8 - NA);
p = 0.002; a statistically significant clinical benefit favoring the highest dose group.
Group
19
20
0
1
AView entire presentation