Pathward Financial Results Presentation Deck
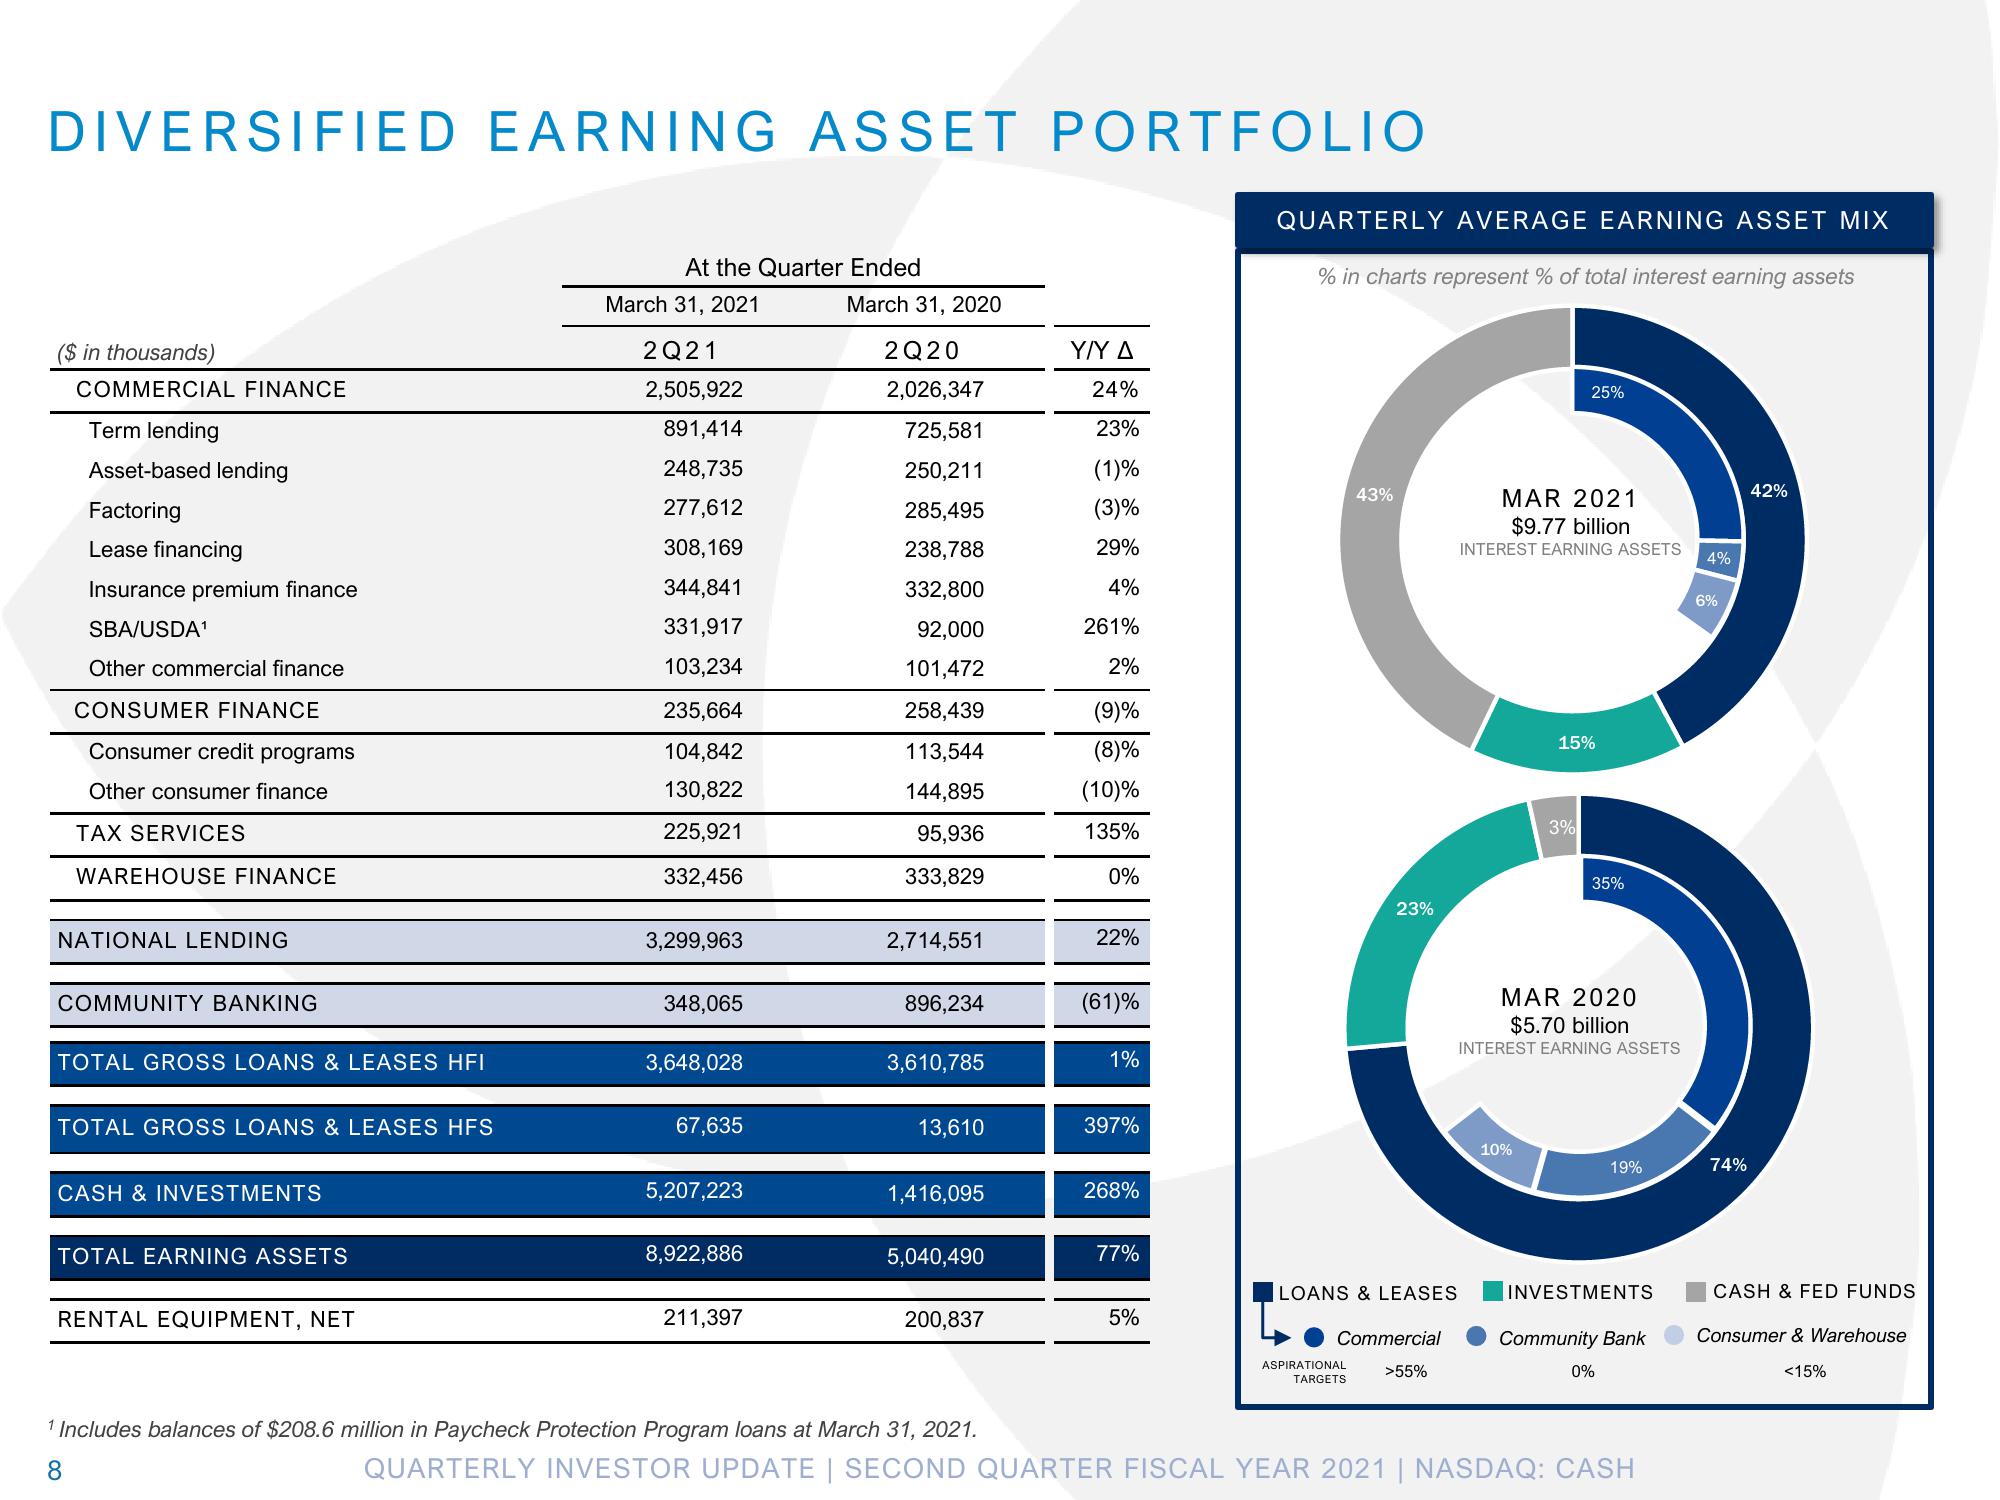
DIVERSIFIED EARNING ASSET PORTFOLIO
($ in thousands)
COMMERCIAL FINANCE
Term lending
Asset-based lending
Factoring
Lease financing
Insurance premium finance
SBA/USDA¹
Other commercial finance
CONSUMER FINANCE
Consumer credit programs
Other consumer finance
TAX SERVICES
WAREHOUSE FINANCE
NATIONAL LENDING
COMMUNITY BANKING
TOTAL GROSS LOANS & LEASES HFI
TOTAL GROSS LOANS & LEASES HFS
CASH & INVESTMENTS
TOTAL EARNING ASSETS
RENTAL EQUIPMENT, NET
At the Quarter Ended
March 31, 2021
2Q21
2,505,922
891,414
248,735
277,612
308,169
344,841
331,917
103,234
235,664
104,842
130,822
225,921
332,456
3,299,963
348,065
3,648,028
67,635
5,207,223
8,922,886
211,397
March 31, 2020
2Q20
2,026,347
725,581
250,211
285,495
238,788
332,800
92,000
101,472
258,439
113,544
144,895
95,936
333,829
2,714,551
896,234
3,610,785
13,610
1,416,095
5,040,490
200,837
Y/Y A
24%
23%
(1)%
(3)%
29%
4%
261%
2%
(9)%
(8)%
(10)%
135%
0%
22%
(61)%
1%
397%
268%
77%
5%
QUARTERLY AVERAGE EARNING ASSET MIX
% in charts represent % of total interest earning assets
43%
23%
ASPIRATIONAL
TARGETS
LOANS & LEASES
Commercial
>55%
MAR 2021
$9.77 billion
INTEREST EARNING ASSETS
25%
10%
15%
3%
MAR 2020
$5.70 billion
INTEREST EARNING ASSETS
35%
19%
INVESTMENTS
Community Bank
0%
¹ Includes balances of $208.6 million in Paycheck Protection Program loans at March 31, 2021.
QUARTERLY INVESTOR UPDATE | SECOND QUARTER FISCAL YEAR 2021 | NASDAQ: CASH
8
4%
6%
74%
42%
CASH & FED FUNDS
Consumer & Warehouse
<15%View entire presentation