Hilltop Holdings Results Presentation Deck
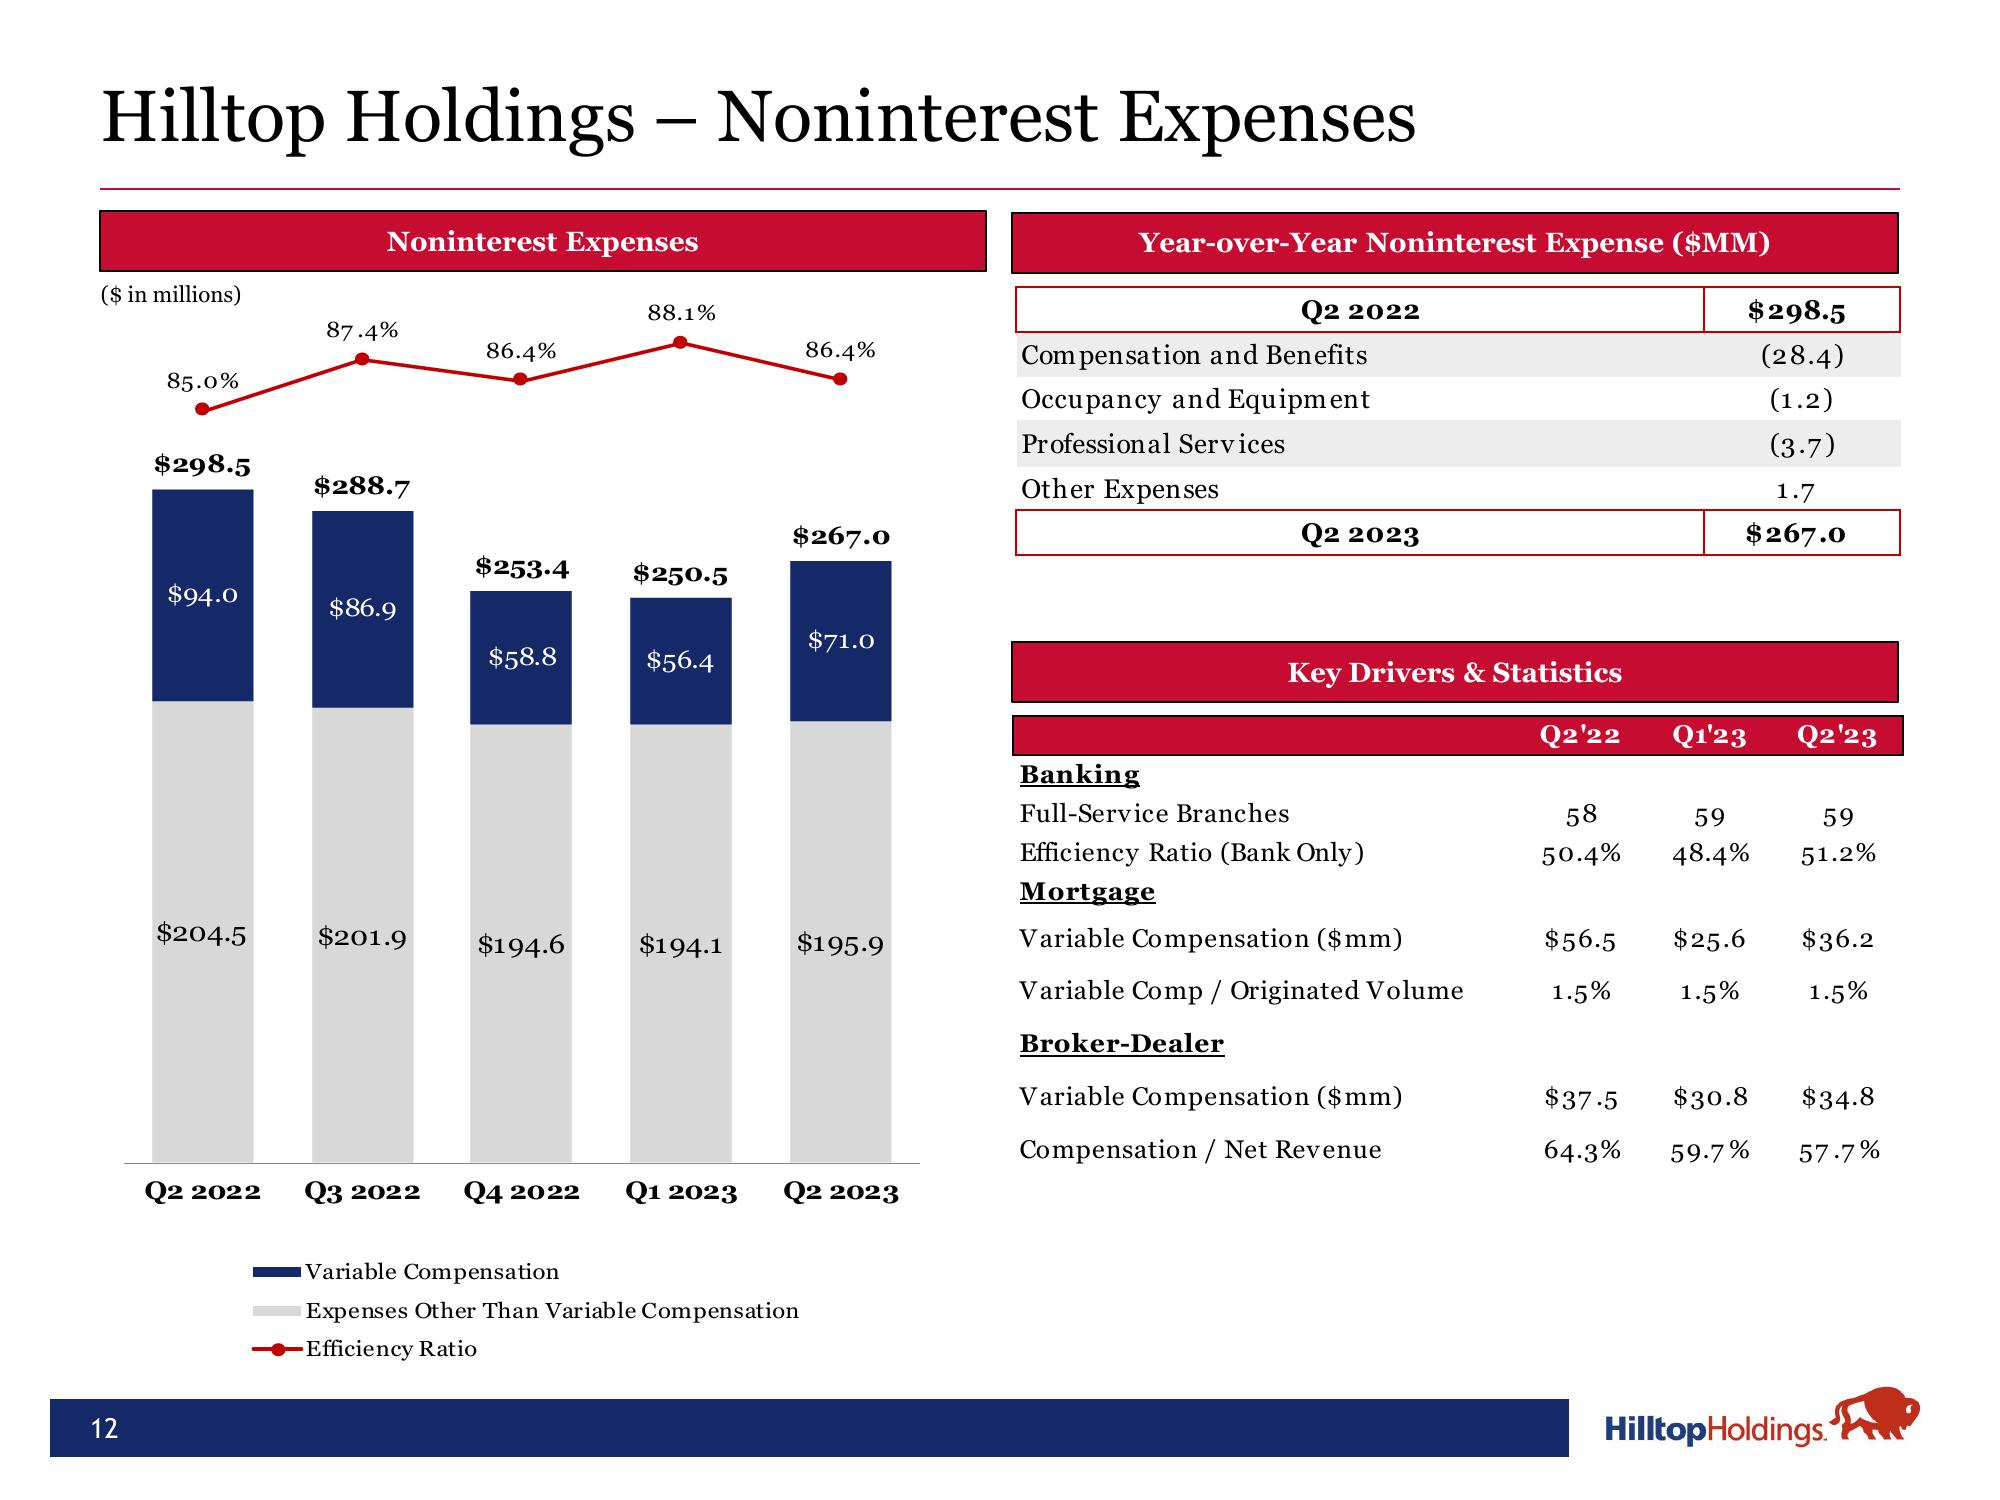
Hilltop Holdings - Noninterest Expenses
($ in millions)
12
85.0%
$298.5
$94.0
$204.5
Noninterest Expenses
87.4%
$288.7
$86.9
$201.9
86.4%
$253.4
$58.8
$194.6
88.1%
$250.5
$56.4
$194.1
Q2 2022 Q3 2022 Q4 2022 Q1 2023
86.4%
$267.0
$71.0
$195.9
Variable Compensation
Expenses Other Than Variable Compensation
Efficiency Ratio
Q2 2023
Year-over-Year Noninterest Expense ($MM)
Compensation and Benefits
Occupancy and Equipment
Professional Services
Other Expenses
Q2 2022
Banking
Full-Service Branches
Broker-Dealer
Q2 2023
Key Drivers & Statistics
Q2'22
Efficiency Ratio (Bank Only)
Mortgage
Variable Compensation ($mm)
Variable Comp / Originated Volume
Variable Compensation ($mm)
Compensation / Net Revenue
58
50.4%
$56.5
1.5%
Q1'23
$298.5
(28.4)
(1.2)
(3.7)
$25.6
1.5%
1.7
$267.0
59
48.4%
Q2'23
59
51.2%
$36.2
1.5%
$37.5 $30.8 $34.8
64.3%
59.7% 57.7%
Hilltop Holdings.View entire presentation