Diageo Results Presentation Deck slide image

Diageo Results Presentation Deck

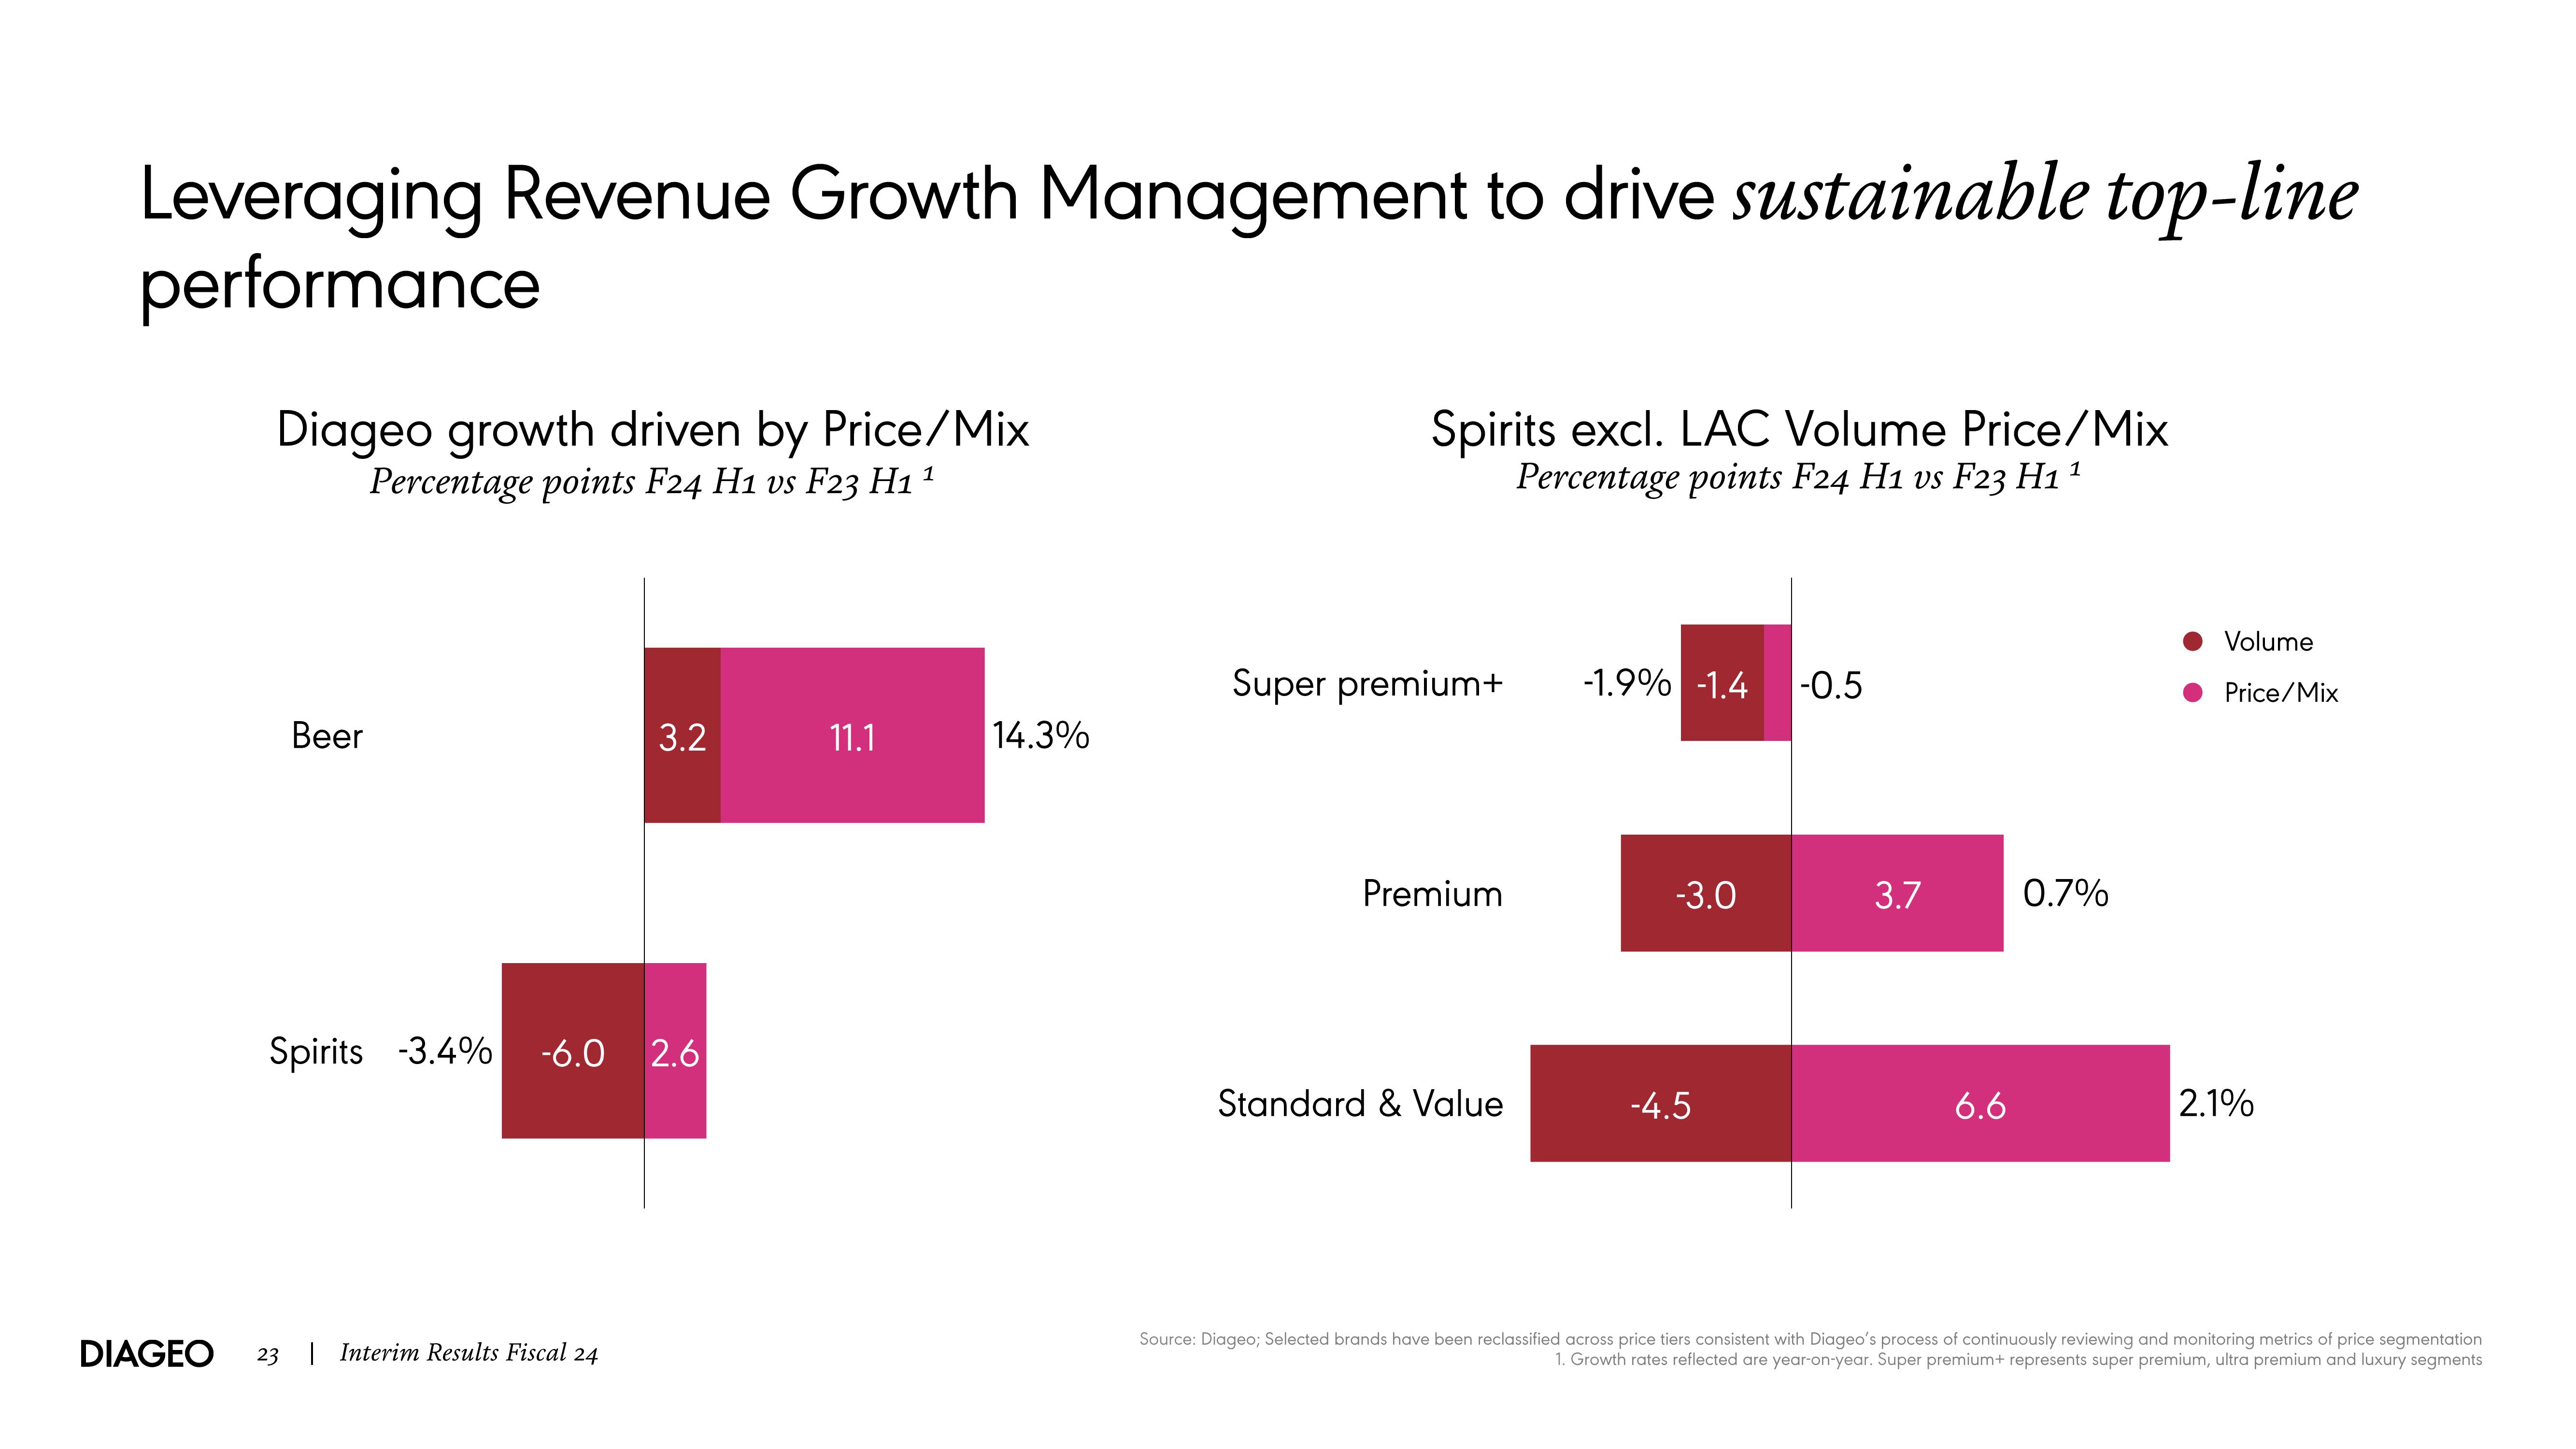
Leveraging Revenue Growth Management to drive sustainable top-line performance Diageo growth driven by Price/Mix Percentage points F24 H1 vs F23 H1¹ Beer Spirits -3.4% 3.2 -6.0 2.6 DIAGEO 23 | Interim Results Fiscal 24 11.1 14.3% Spirits excl. LAC Volume Price/Mix Percentage points F24 H1 vs F23 H1¹ Super premium+ Premium Standard & Value -1.9% -1.4 -3.0 -4.5 -0.5 3.7 6.6 0.7% Volume Price/Mix 2.1% Source: Diageo; Selected brands have been reclassified across price tiers consistent with Diageo's process of continuously reviewing and monitoring metrics of price segmentation 1. Growth rates reflected are year-on-year. Super premium+ represents super premium, ultra premium and luxury segments
View entire presentation