Proterra Investor Presentation Deck
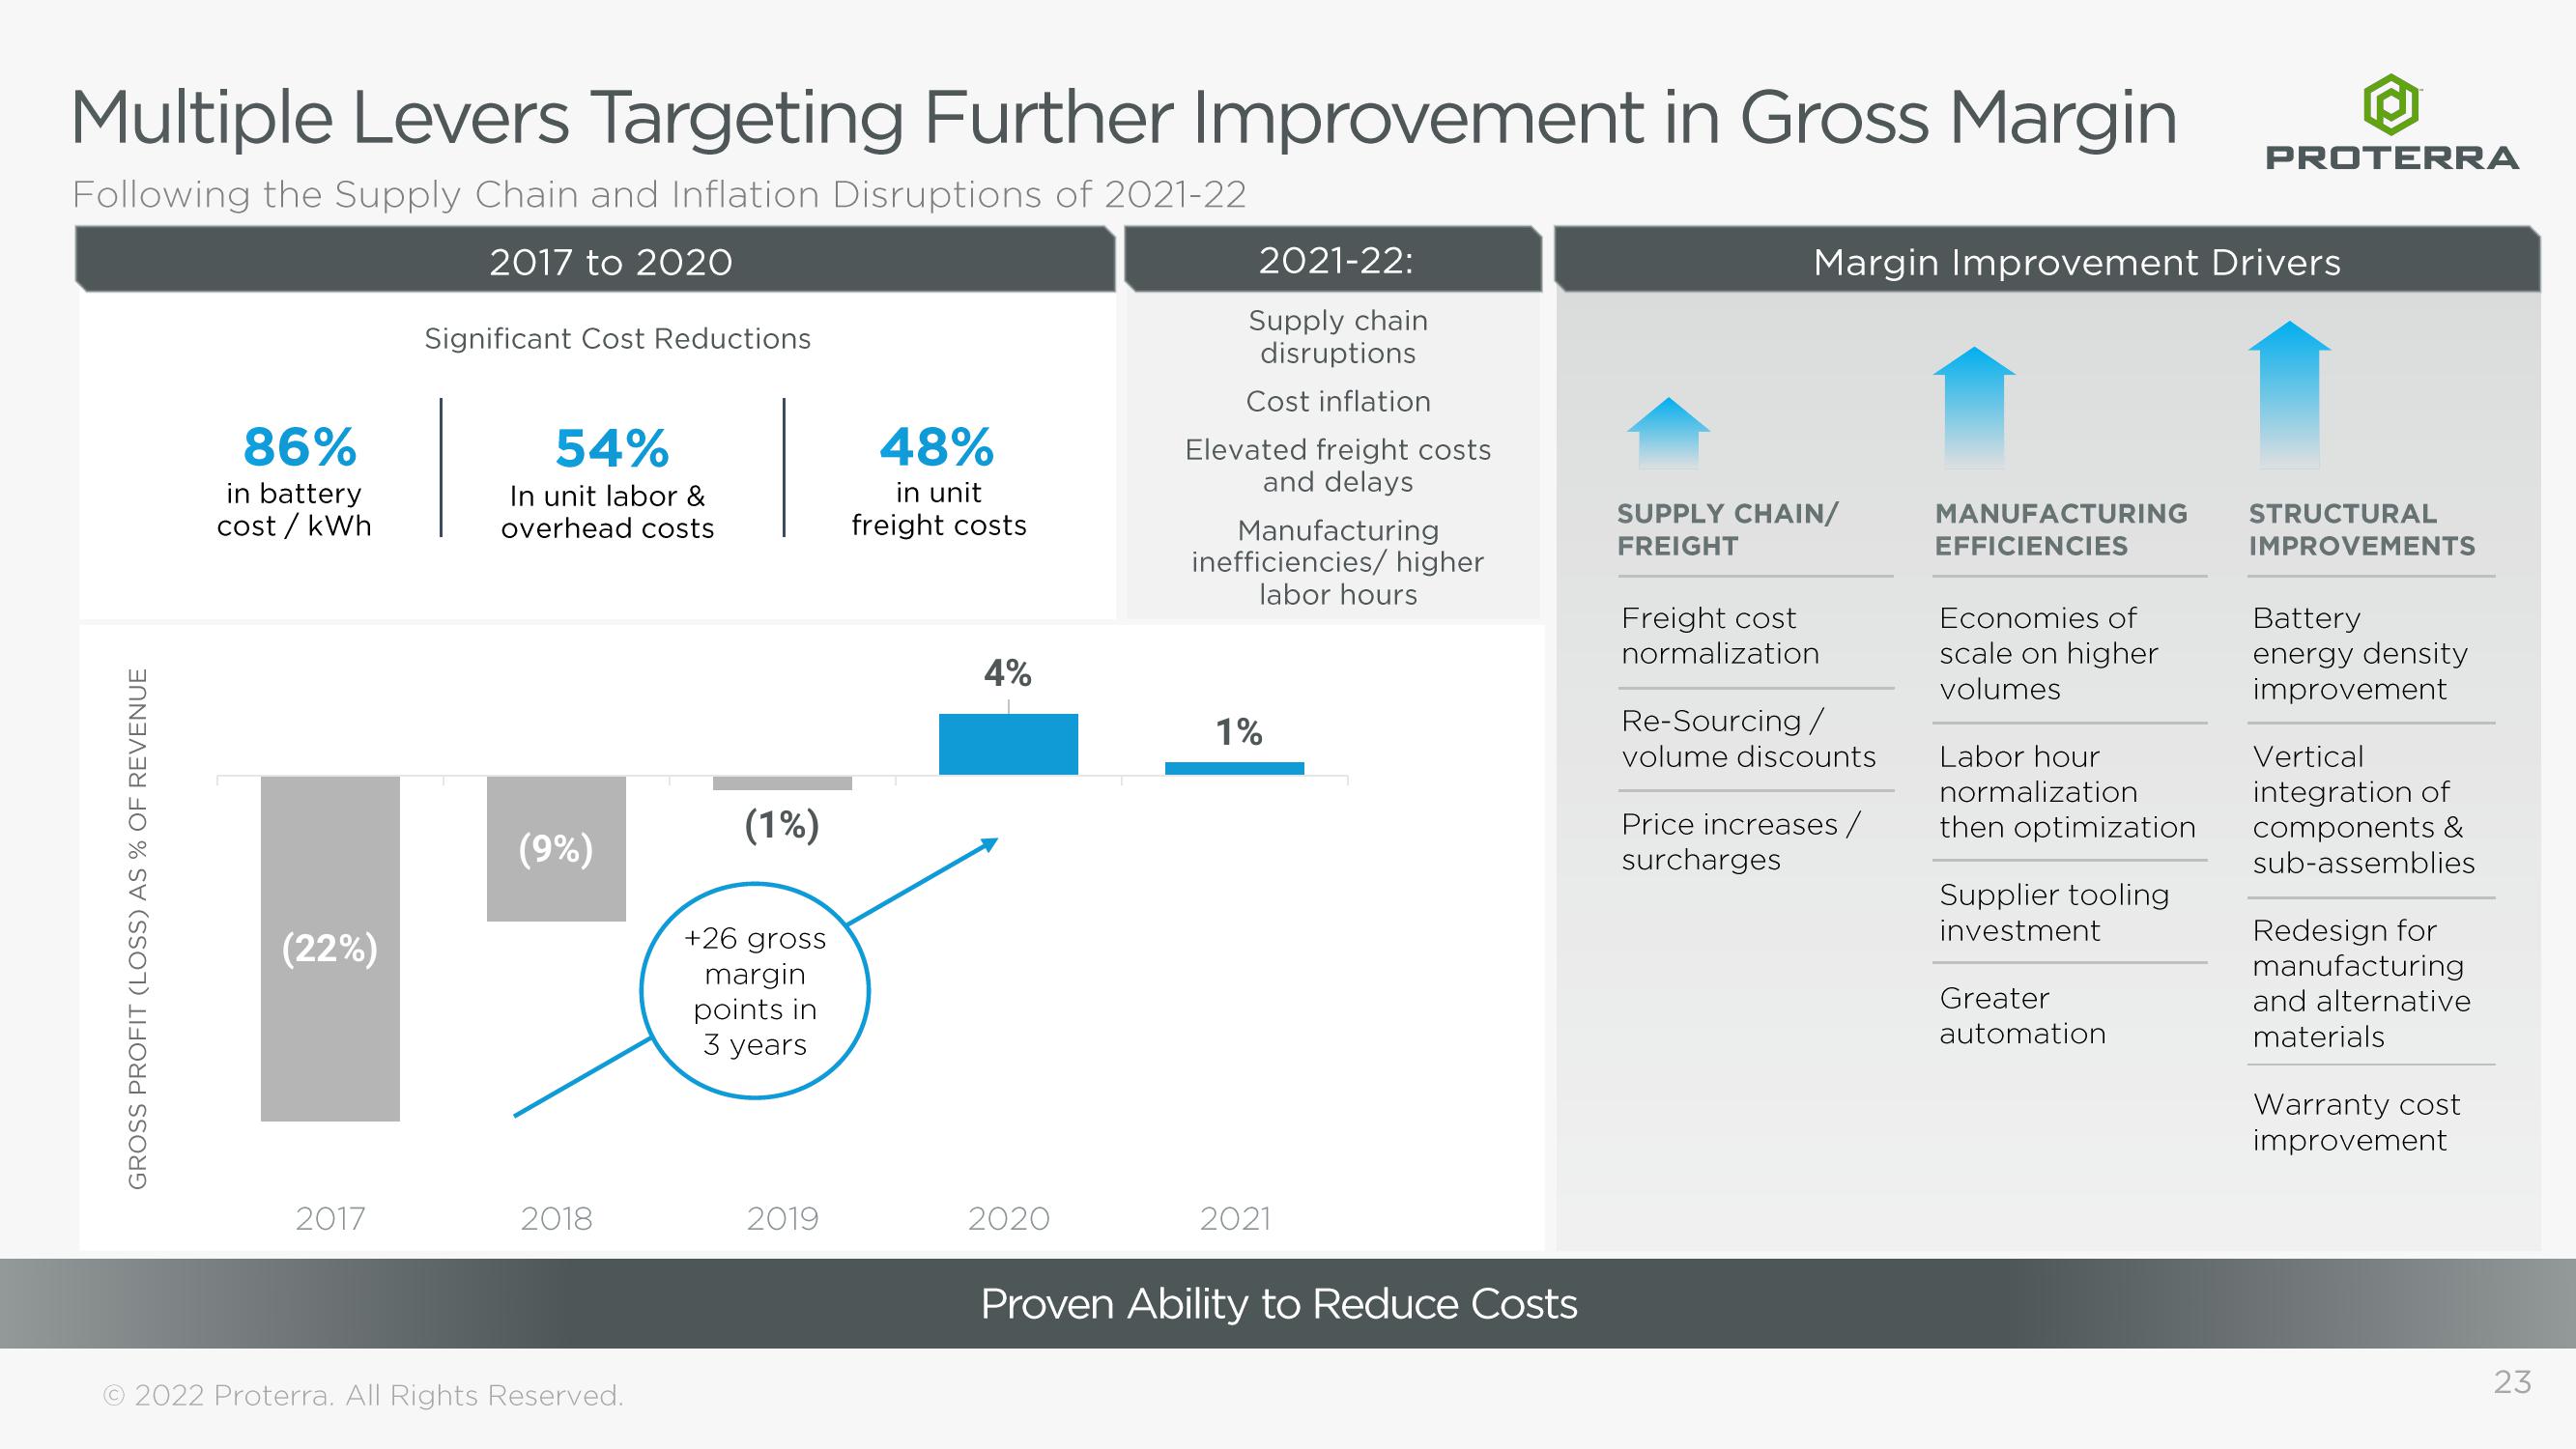
Multiple Levers Targeting Further Improvement in Gross Margin
Following the Supply Chain and Inflation Disruptions of 2021-22
2017 to 2020
Significant Cost Reductions
GROSS PROFIT (LOSS) AS % OF REVENUE
86%
in battery
cost / kWh
(22%)
2017
54%
In unit labor &
overhead costs
(9%)
2018
© 2022 Proterra. All Rights Reserved.
(1%)
+26 gross
margin
points in
3 years
2019
48%
in unit
freight costs
4%
2020
2021-22:
Supply chain
disruptions
Cost inflation
Elevated freight costs
and delays
Manufacturing
inefficiencies/ higher
labor hours
1%
2021
Proven Ability to Reduce Costs
Margin Improvement Drivers
SUPPLY CHAIN/
FREIGHT
Freight cost
normalization
Re-Sourcing /
volume discounts
Price increases/
surcharges
MANUFACTURING
EFFICIENCIES
Economies of
scale on higher
volumes
Labor hour
normalization
then optimization
Supplier tooling
investment
PROTERRA
Greater
automation
STRUCTURAL
IMPROVEMENTS
Battery
energy density
improvement
Vertical
integration of
components &
sub-assemblies
Redesign for
manufacturing
and alternative
materials
Warranty cost
improvement
23View entire presentation