Ashtead Group Results Presentation Deck
US TRADING
■
General Tool
■
Specialty
Oil and gas
Q1
-9%
+6%
-62%
Rental revenue
Q2
-7%
+18%
-53%
15 Full year results ¦ 30 April 2021
Q3
-3%
-4%
+6%
-40%
Q4
-3%
+7%
+18%
-25%
Full year
Total
-8%
Rental only revenue presented on a billing day basis
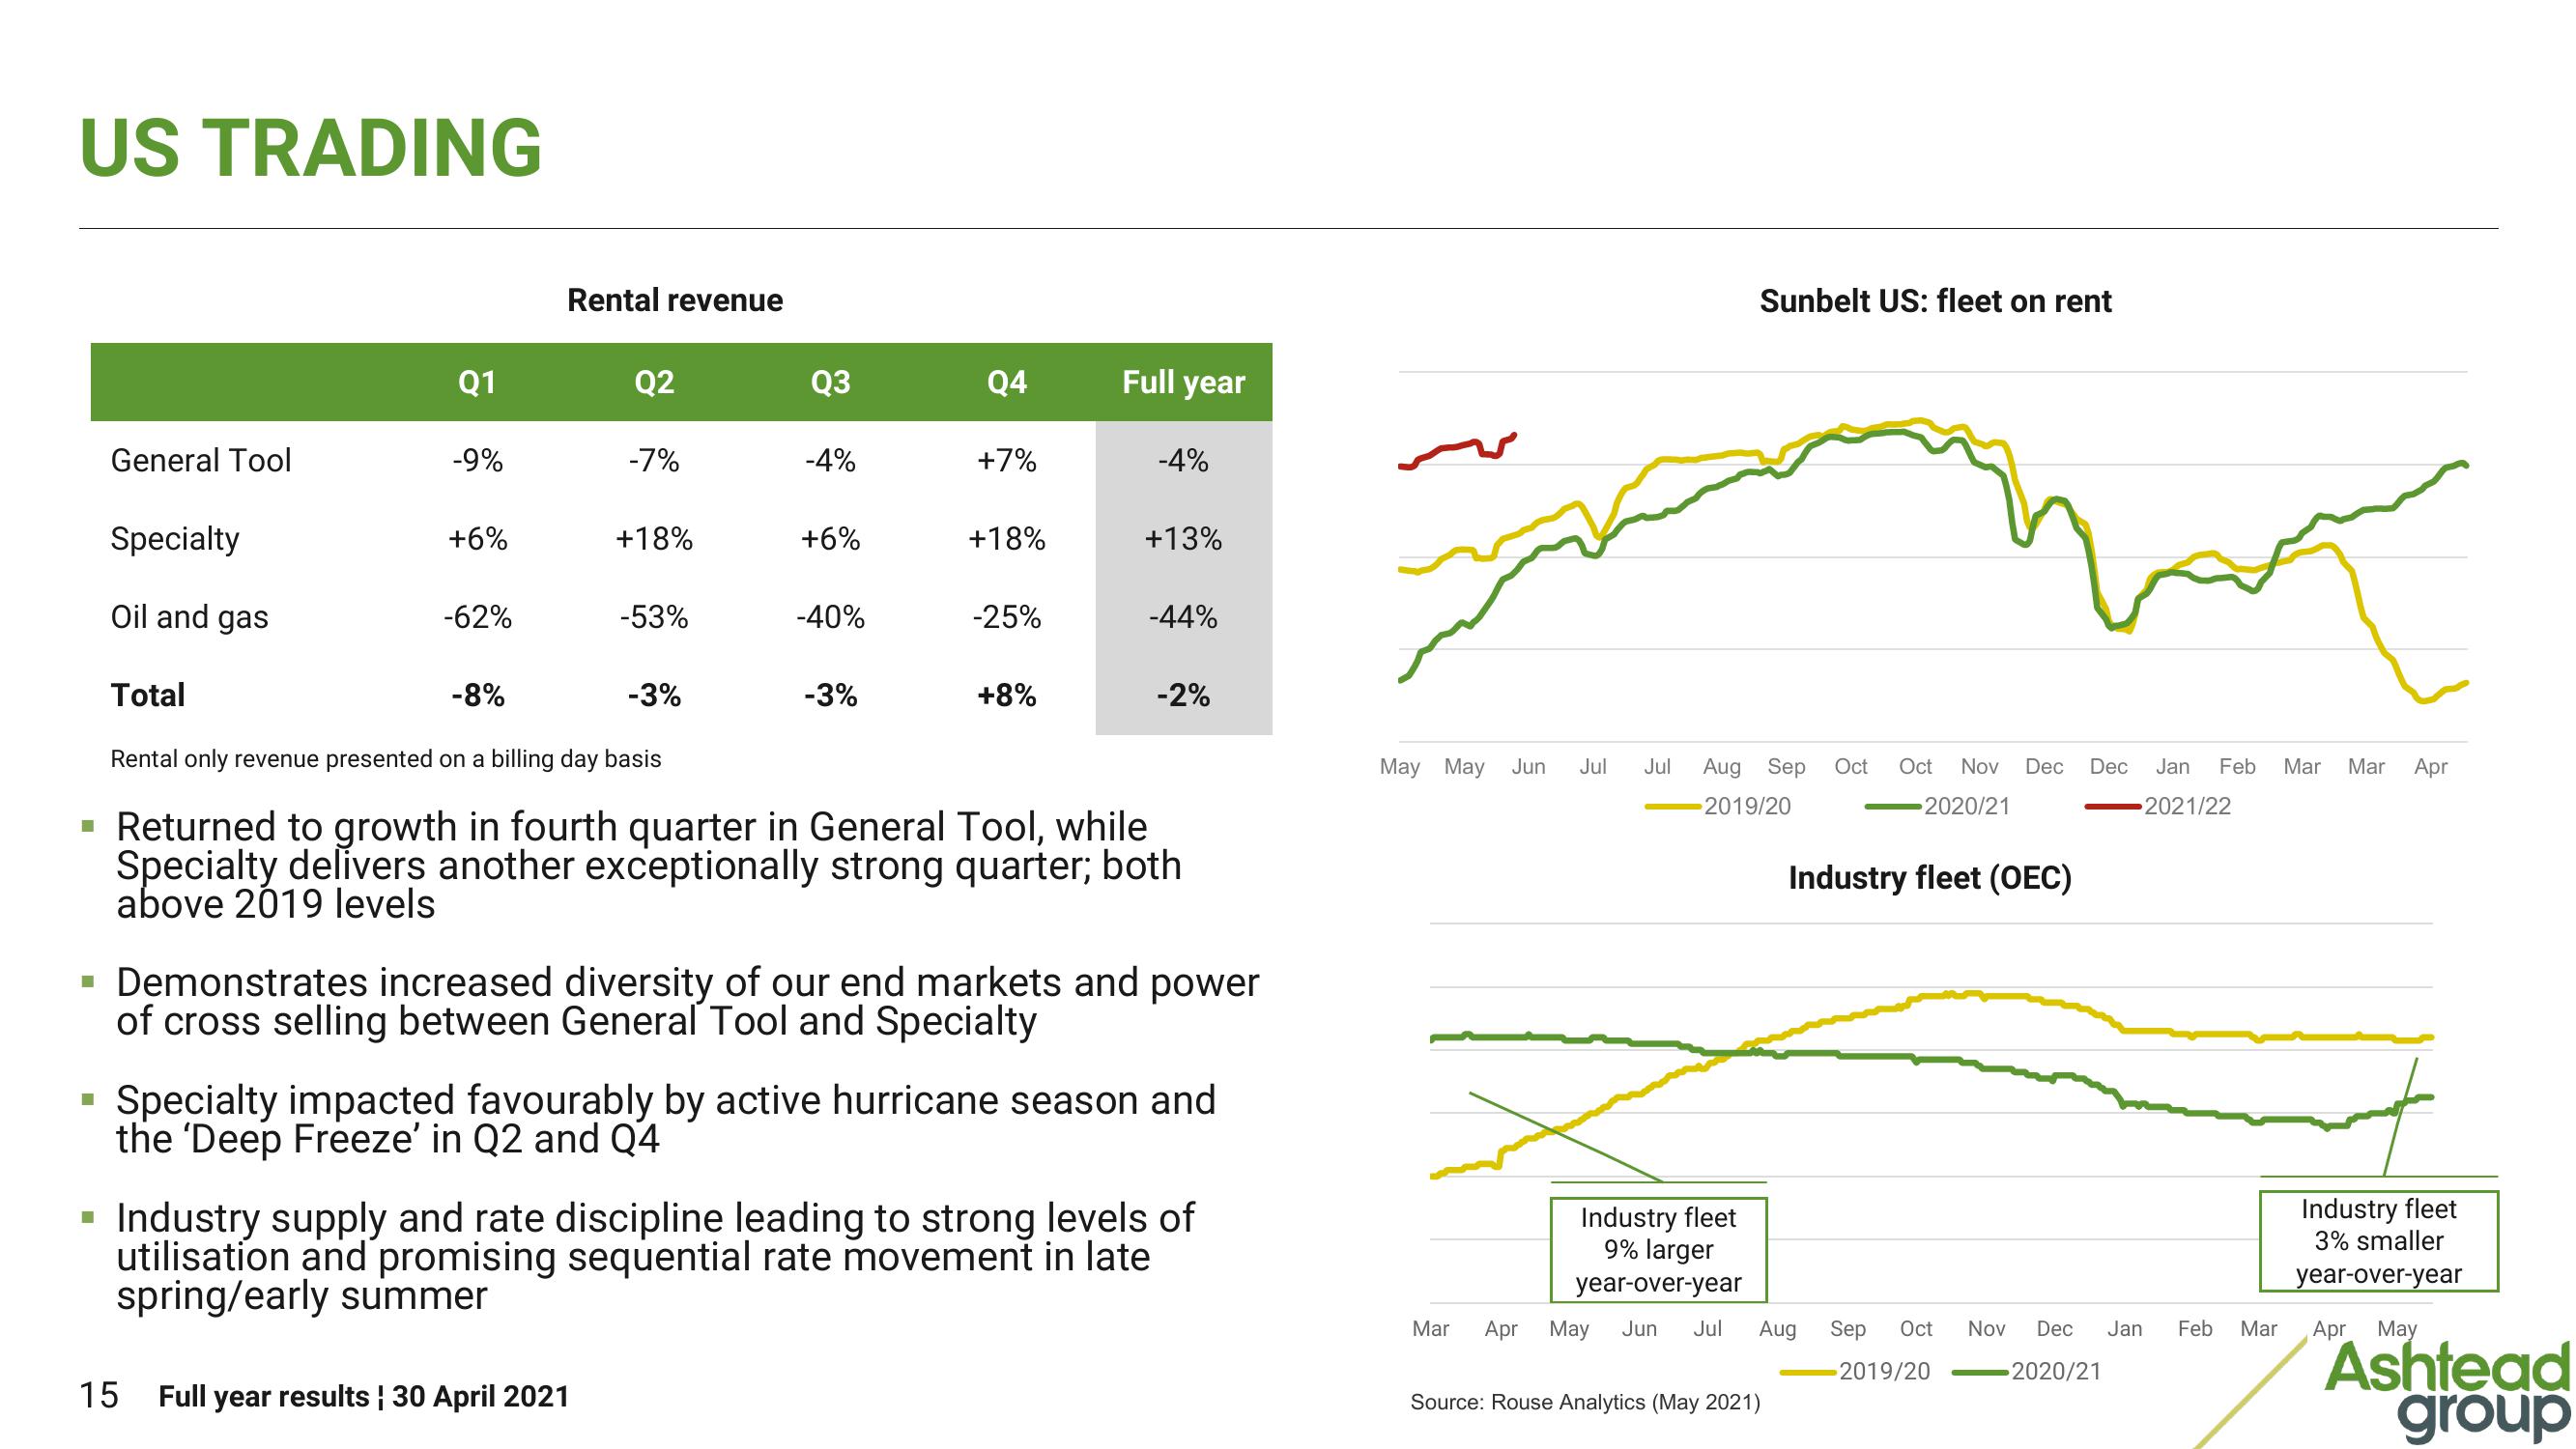
Returned to growth in fourth quarter in General Tool, while
Specialty delivers another exceptionally strong quarter; both
above 2019 levels
+8%
-4%
+13%
-44%
▪ Demonstrates increased diversity of our end markets and power
of cross selling between General Tool and Specialty
-2%
Specialty impacted favourably by active hurricane season and
the 'Deep Freeze' in Q2 and Q4
Industry supply and rate discipline leading to strong levels of
utilisation and promising sequential rate movement in late
spring/early summer
May May
Mar
Jun Jul
Jul
Sunbelt US: fleet on rent
Aug Sep
2019/20
Oct Oct Nov Dec Dec Jan Feb Mar Mar Apr
2020/21
2021/22
Industry fleet (OEC)
Source: Rouse Analytics (May 2021)
Industry fleet
9% larger
year-over-year
Apr May Jun Jul Aug
Sep Oct Nov Dec
2019/20
2020/21
Jan Feb Mar
Industry fleet
3% smaller
year-over-year
Apr May
Ashtead
groupView entire presentation