Flutter Investor Day Presentation Deck
International
Pro forma £m
Average monthly players ('000s)
Sportsbook stakes
Sportsbook net revenue margin
Sports revenue
Gaming revenue
Total revenue
Cost of sales
Cost of sales as a % of net revenue
Gross profit
Sales & marketing costs
Contribution
Other operating costs
Adjusted EBITDA
Adjusted EBITDA margin
Depreciation and amortisation
Adjusted operating profit
Flutter
H1 2021 H1 2020
1,945
1,999
871
555
9.1%
118
562
680
(199)
29.3%
481
(171)
310
(131)
179
26.3%
(25)
154
8.7%
74
727
801
(181)
22.6%
620
(110)
510
(113)
397
49.5%
(24)
373
YOY
-3%
+57%
+40bps
+59%
-23%
-15%
+10%
+670bps
-22%
+55%
-39%
+16%
-55%
-2,330bps
+4%
-59%
YOY CC
+61%
+40bps
+62%
-19%
-11%
+14%
+640bps
-18%
+71%
-37%
+16%
-52%
-2,280bps
+7%
-56%
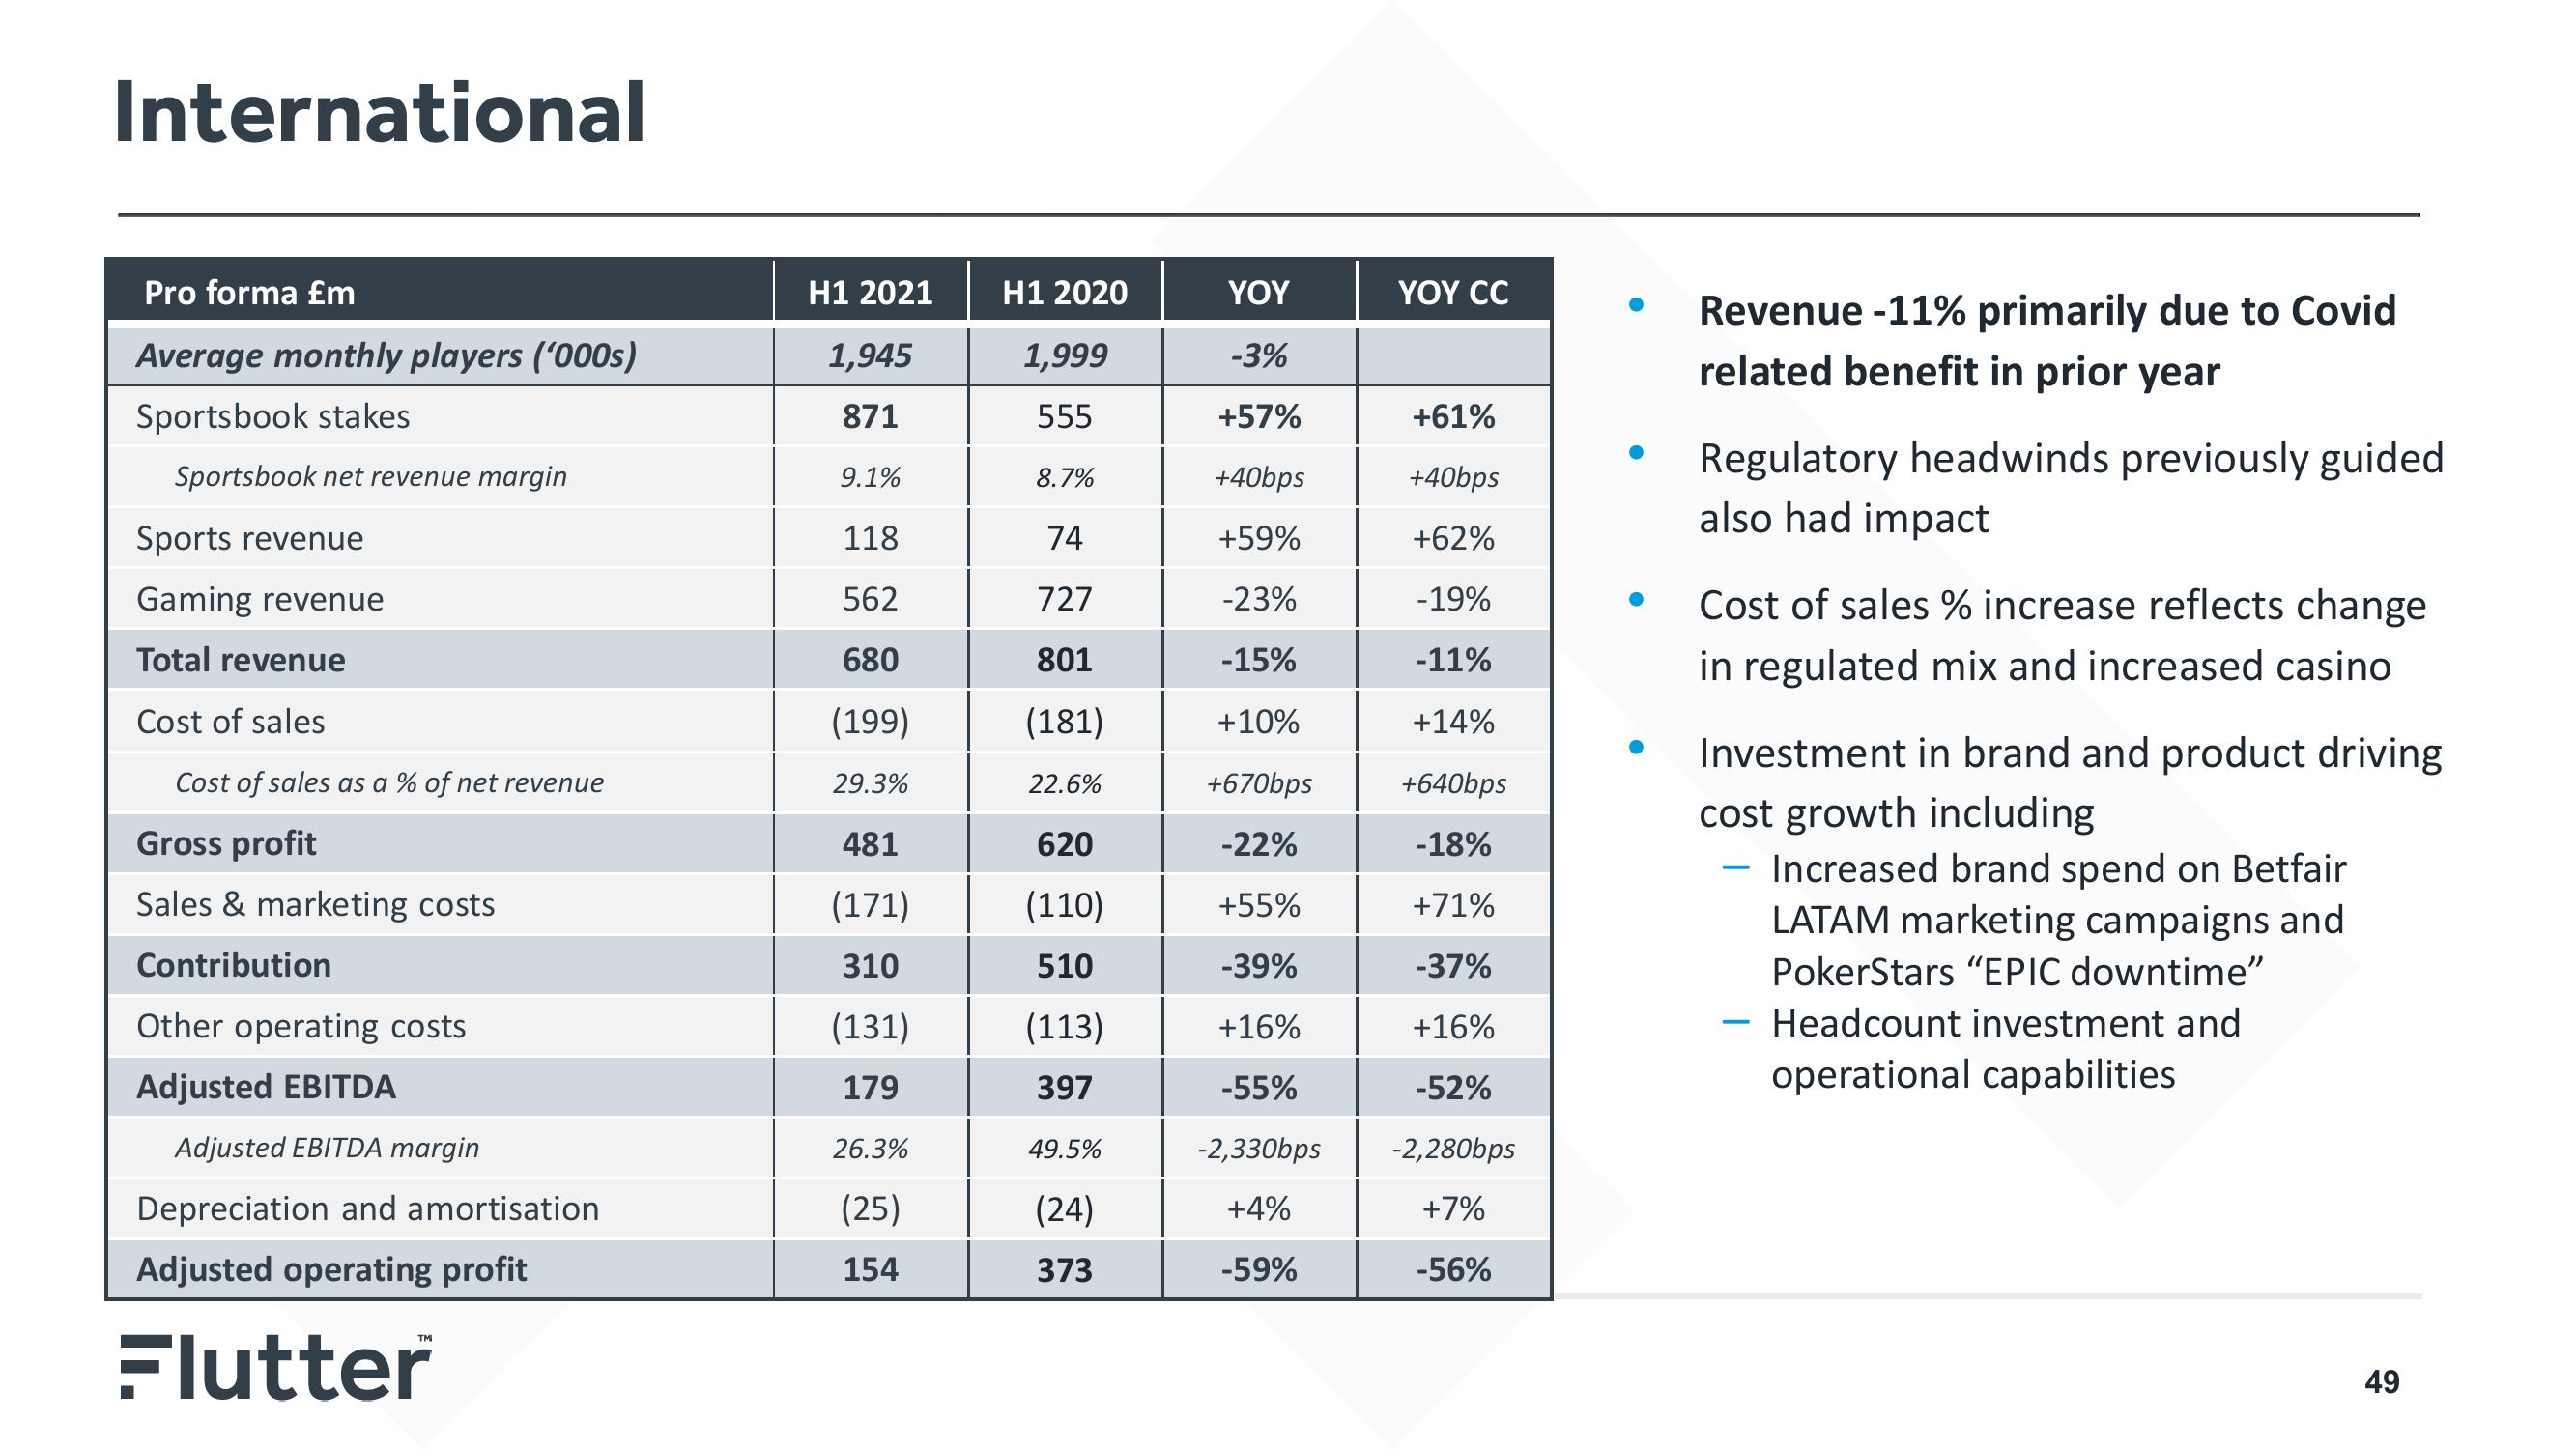
Revenue -11% primarily due to Covid
related benefit in prior year
Regulatory headwinds previously guided
also had impact
Cost of sales % increase reflects change
in regulated mix and increased casino
Investment in brand and product driving
cost growth including
Increased brand spend on Betfair
LATAM marketing campaigns and
PokerStars "EPIC downtime"
Headcount investment and
operational capabilities
49View entire presentation