Acast Results Presentation Deck
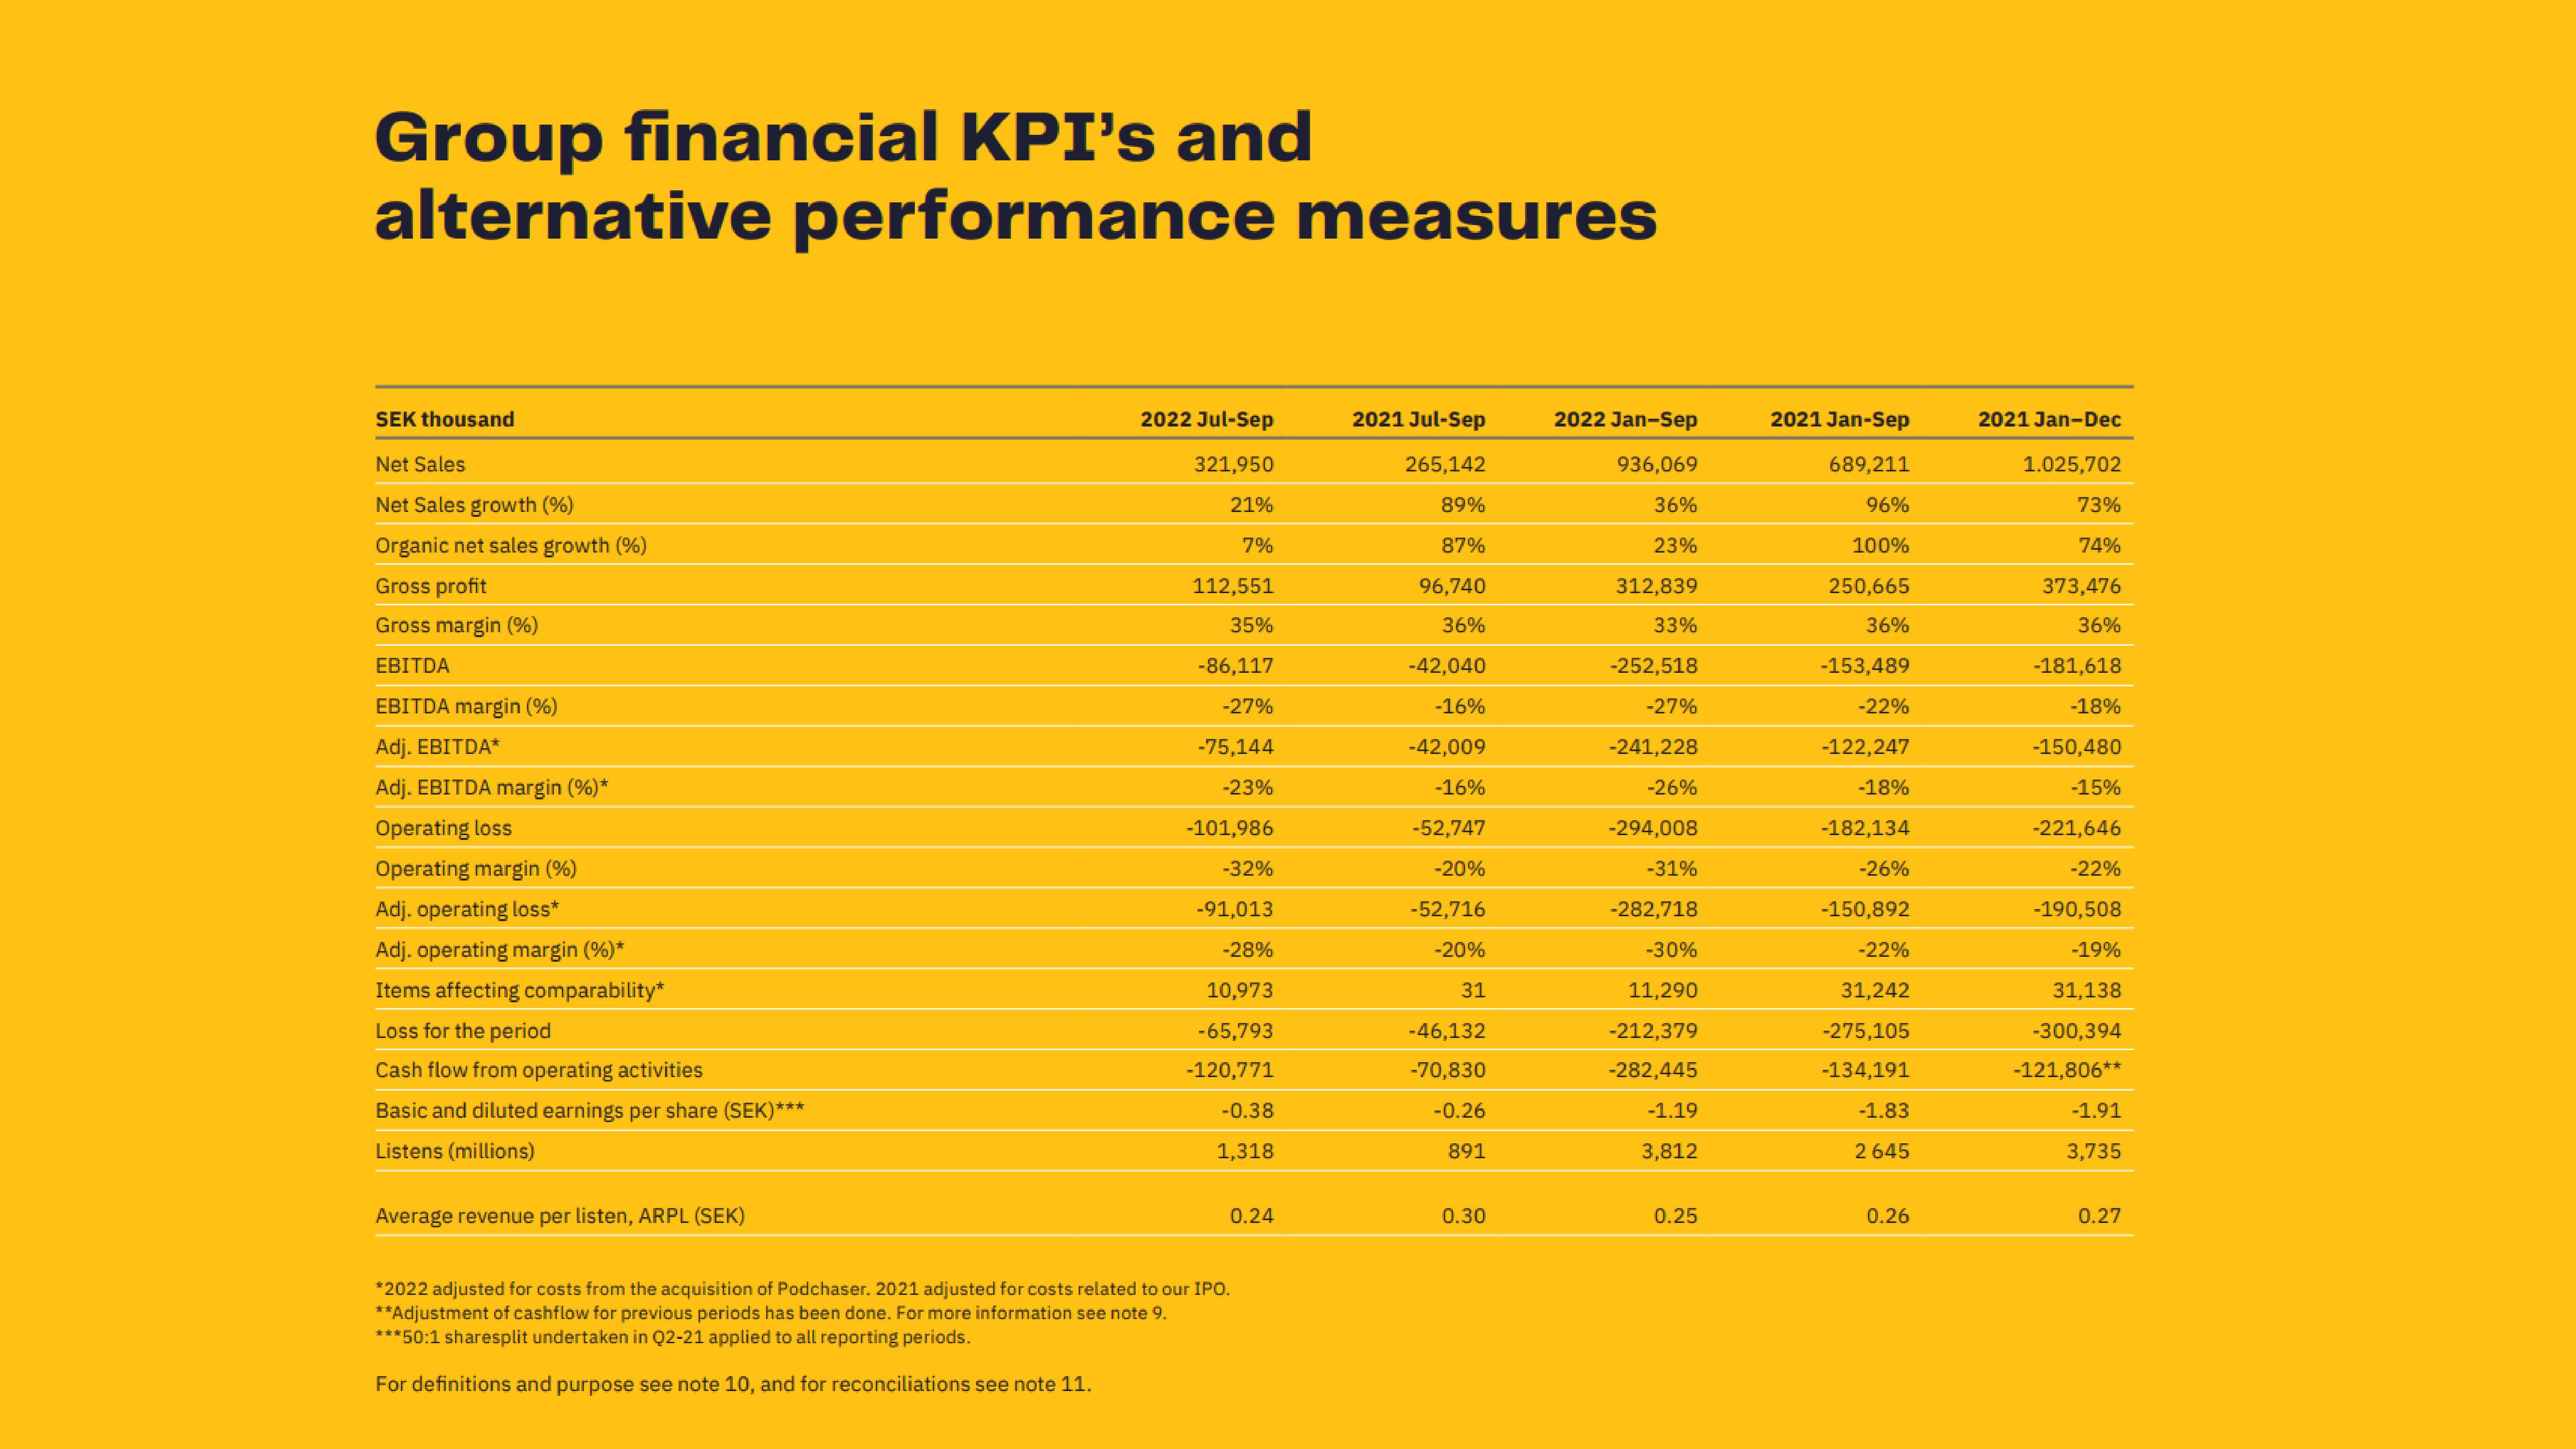
Group financial KPI's and
alternative performance measures
SEK thousand
Net Sales
Net Sales growth (%)
Organic net sales growth (%)
Gross profit
Gross margin (%)
EBITDA
EBITDA margin (%)
Adj. EBITDA*
Adj. EBITDA margin (%)*
Operating loss
Operating margin (%)
Adj. operating loss*
Adj. operating margin (%) *
Items affecting comparability*
Loss for the period
Cash flow from operating activities
Basic and diluted earnings per share (SEK)***
Listens (millions)
Average revenue per listen, ARPL (SEK)
2022 Jul-Sep
321,950
21%
7%
112,551
35%
-86,117
-27%
-75,144
-23%
-101,986
-32%
-91,013
-28%
10,973
-65,793
-120,771
-0.38
1,318
0.24
*2022 adjusted for costs from the acquisition of Podchaser. 2021 adjusted for costs related to our IPO.
**Adjustment of cashflow for previous periods has been done. For more information see note 9.
***50:1 sharesplit undertaken in Q2-21 applied to all reporting periods.
For definitions and purpose see note 10, and for reconciliations see note 11.
2021 Jul-Sep
265,142
89%
87%
96,740
36%
-42,040
-16%
-42,009
-16%
-52,747
-20%
-52,716
-20%
31
-46,132
-70,830
-0.26
891
0.30
2022 Jan-Sep
936,069
36%
23%
312,839
33%
-252,518
-27%
-241,228
-26%
-294,008
-31%
-282,718
-30%
11,290
-212,379
-282,445
-1.19
3,812
0.25
2021 Jan-Sep
689,211
96%
100%
250,665
36%
-153,489
-22%
-122,247
-18%
-182,134
-26%
-150,892
-22%
31,242
-275,105
-134,191
-1.83
2645
0.26
2021 Jan-Dec
1.025,702
73%
74%
373,476
36%
-181,618
-18%
-150,480
-15%
-221,646
-22%
-190,508
-19%
31,138
-300,394
-121,806**
-1.91
3,735
0.27View entire presentation