Factset Results Presentation Deck
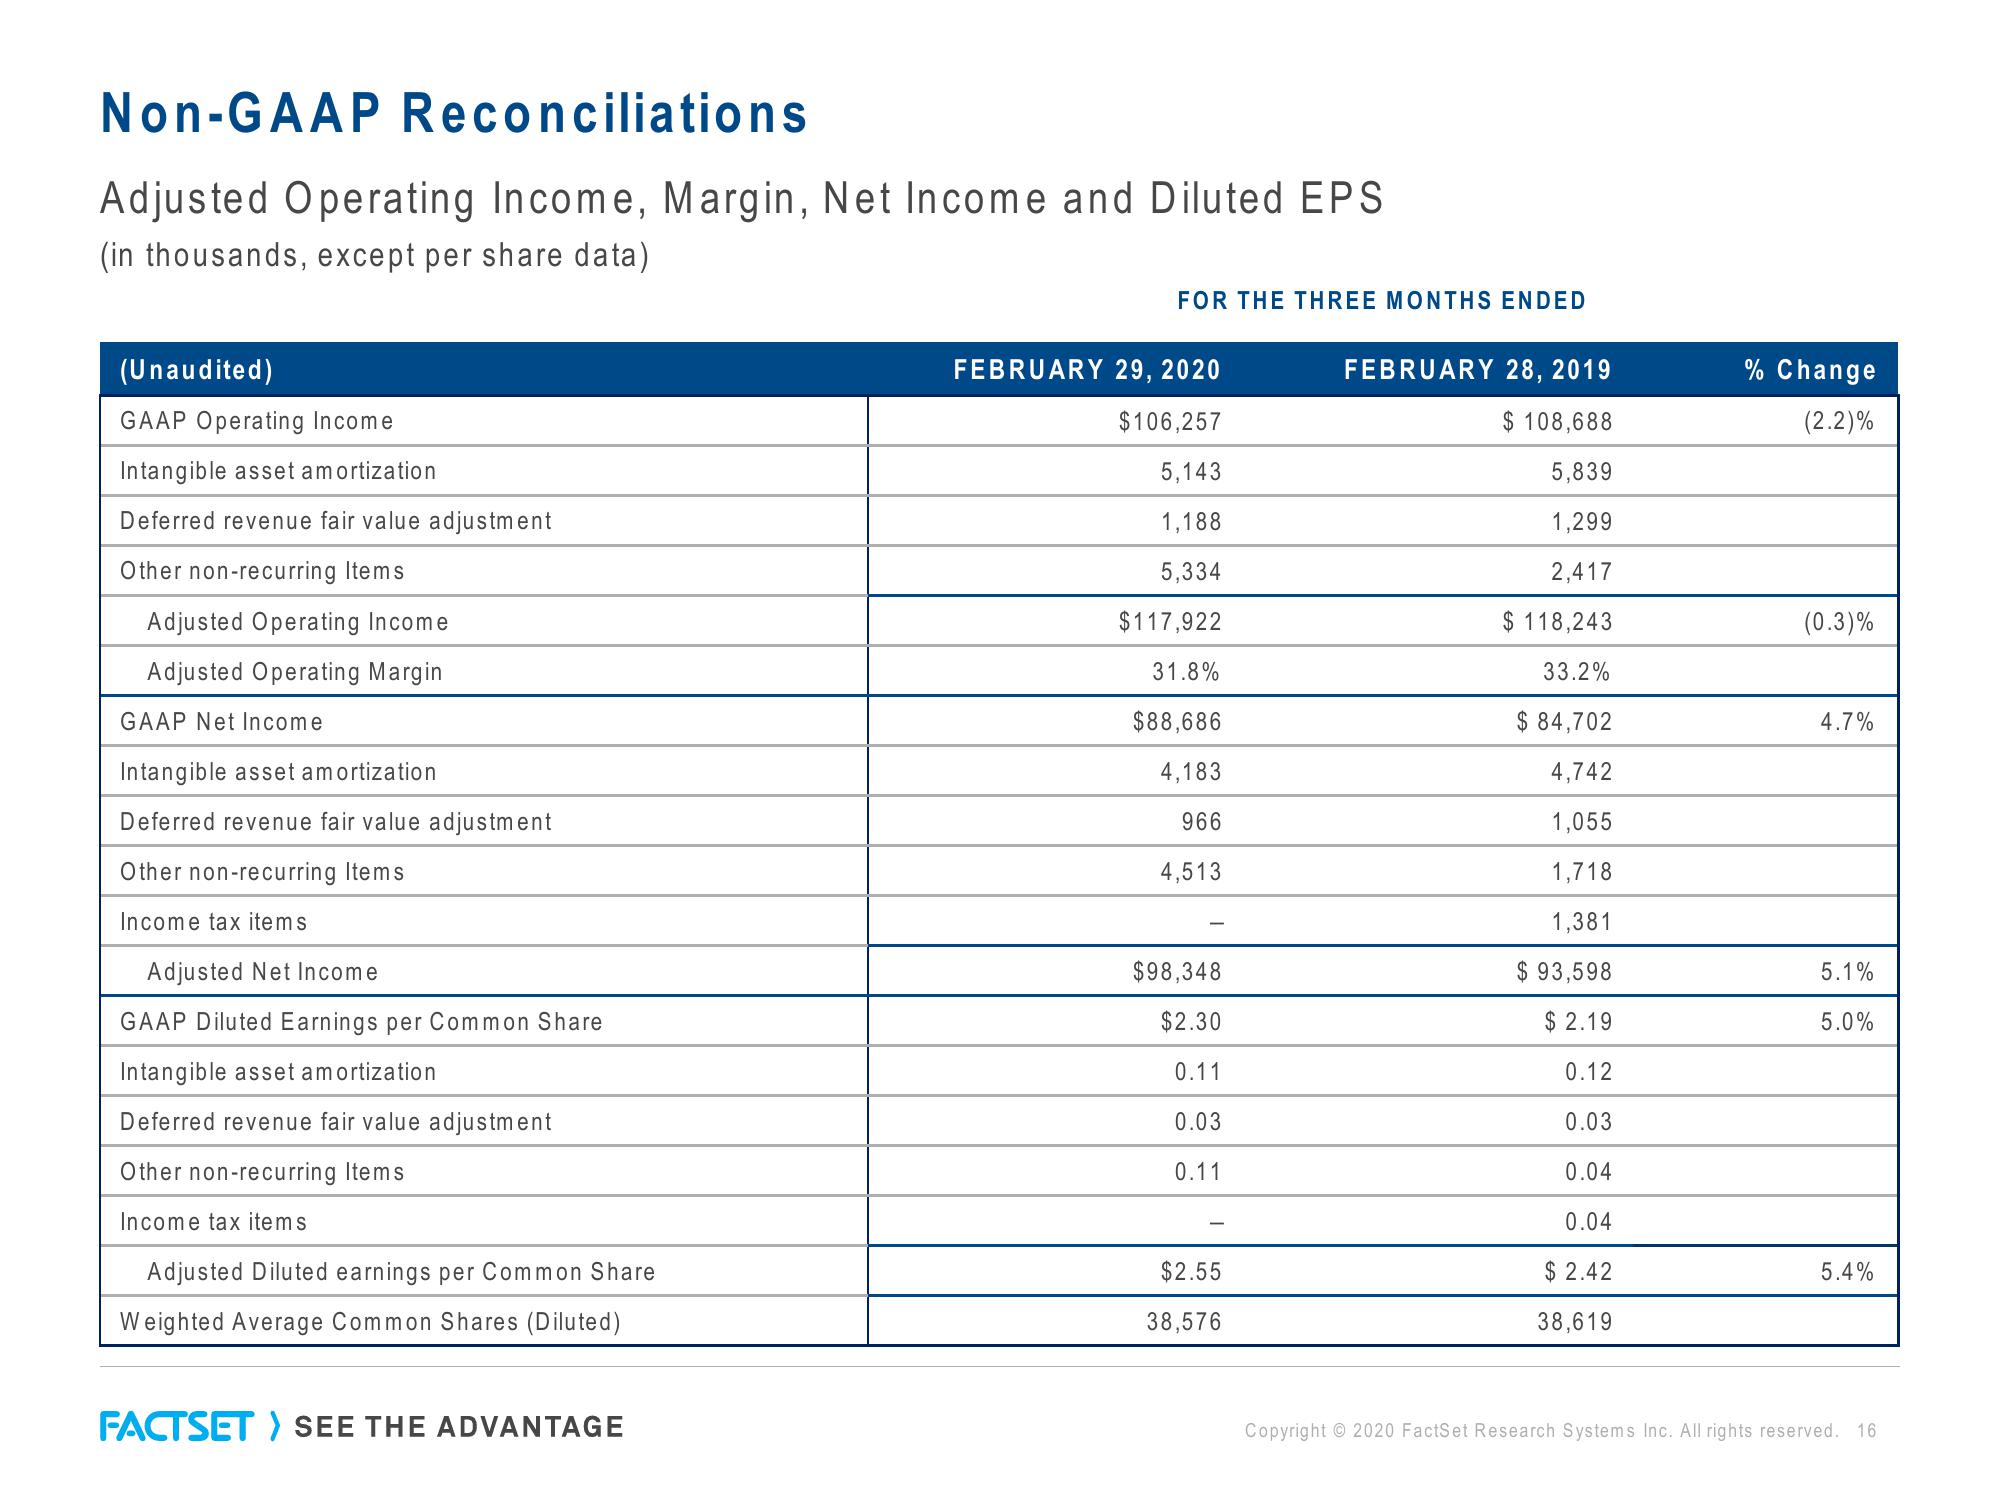
Non-GAAP Reconciliations
Adjusted Operating Income, Margin, Net Income and Diluted EPS
(in thousands, except per share data)
(Unaudited)
GAAP Operating Income
Intangible asset amortization
Deferred revenue fair value adjustment
Other non-recurring Items
Adjusted Operating Income
Adjusted Operating Margin
GAAP Net Income
Intangible asset amortization
Deferred revenue fair value adjustment
Other non-recurring Items
Income tax items
Adjusted Net Income
GAAP Diluted Earnings per Common Share
Intangible asset amortization
Deferred revenue fair value adjustment
Other non-recurring Items
Income tax items
Adjusted Diluted earnings per Common Share
Weighted Average Common Shares (Diluted)
FACTSET > SEE THE ADVANTAGE
FOR THE THREE MONTHS ENDED
FEBRUARY 29, 2020
$106,257
5,143
1,188
5,334
$117,922
31.8%
$88,686
4,183
966
4,513
$98,348
$2.30
0.11
0.03
0.11
$2.55
38,576
FEBRUARY 28, 2019
$ 108,688
5,839
1,299
2,417
$ 118,243
33.2%
$ 84,702
4,742
1,055
1,718
1,381
$ 93,598
$ 2.19
0.12
0.03
0.04
0.04
$2.42
38,619
% Change
(2.2)%
(0.3)%
4.7%
5.1%
5.0%
5.4%
Copyright © 2020 FactSet Research Systems Inc. All rights reserved. 16View entire presentation