Syniverse SPAC Presentation Deck
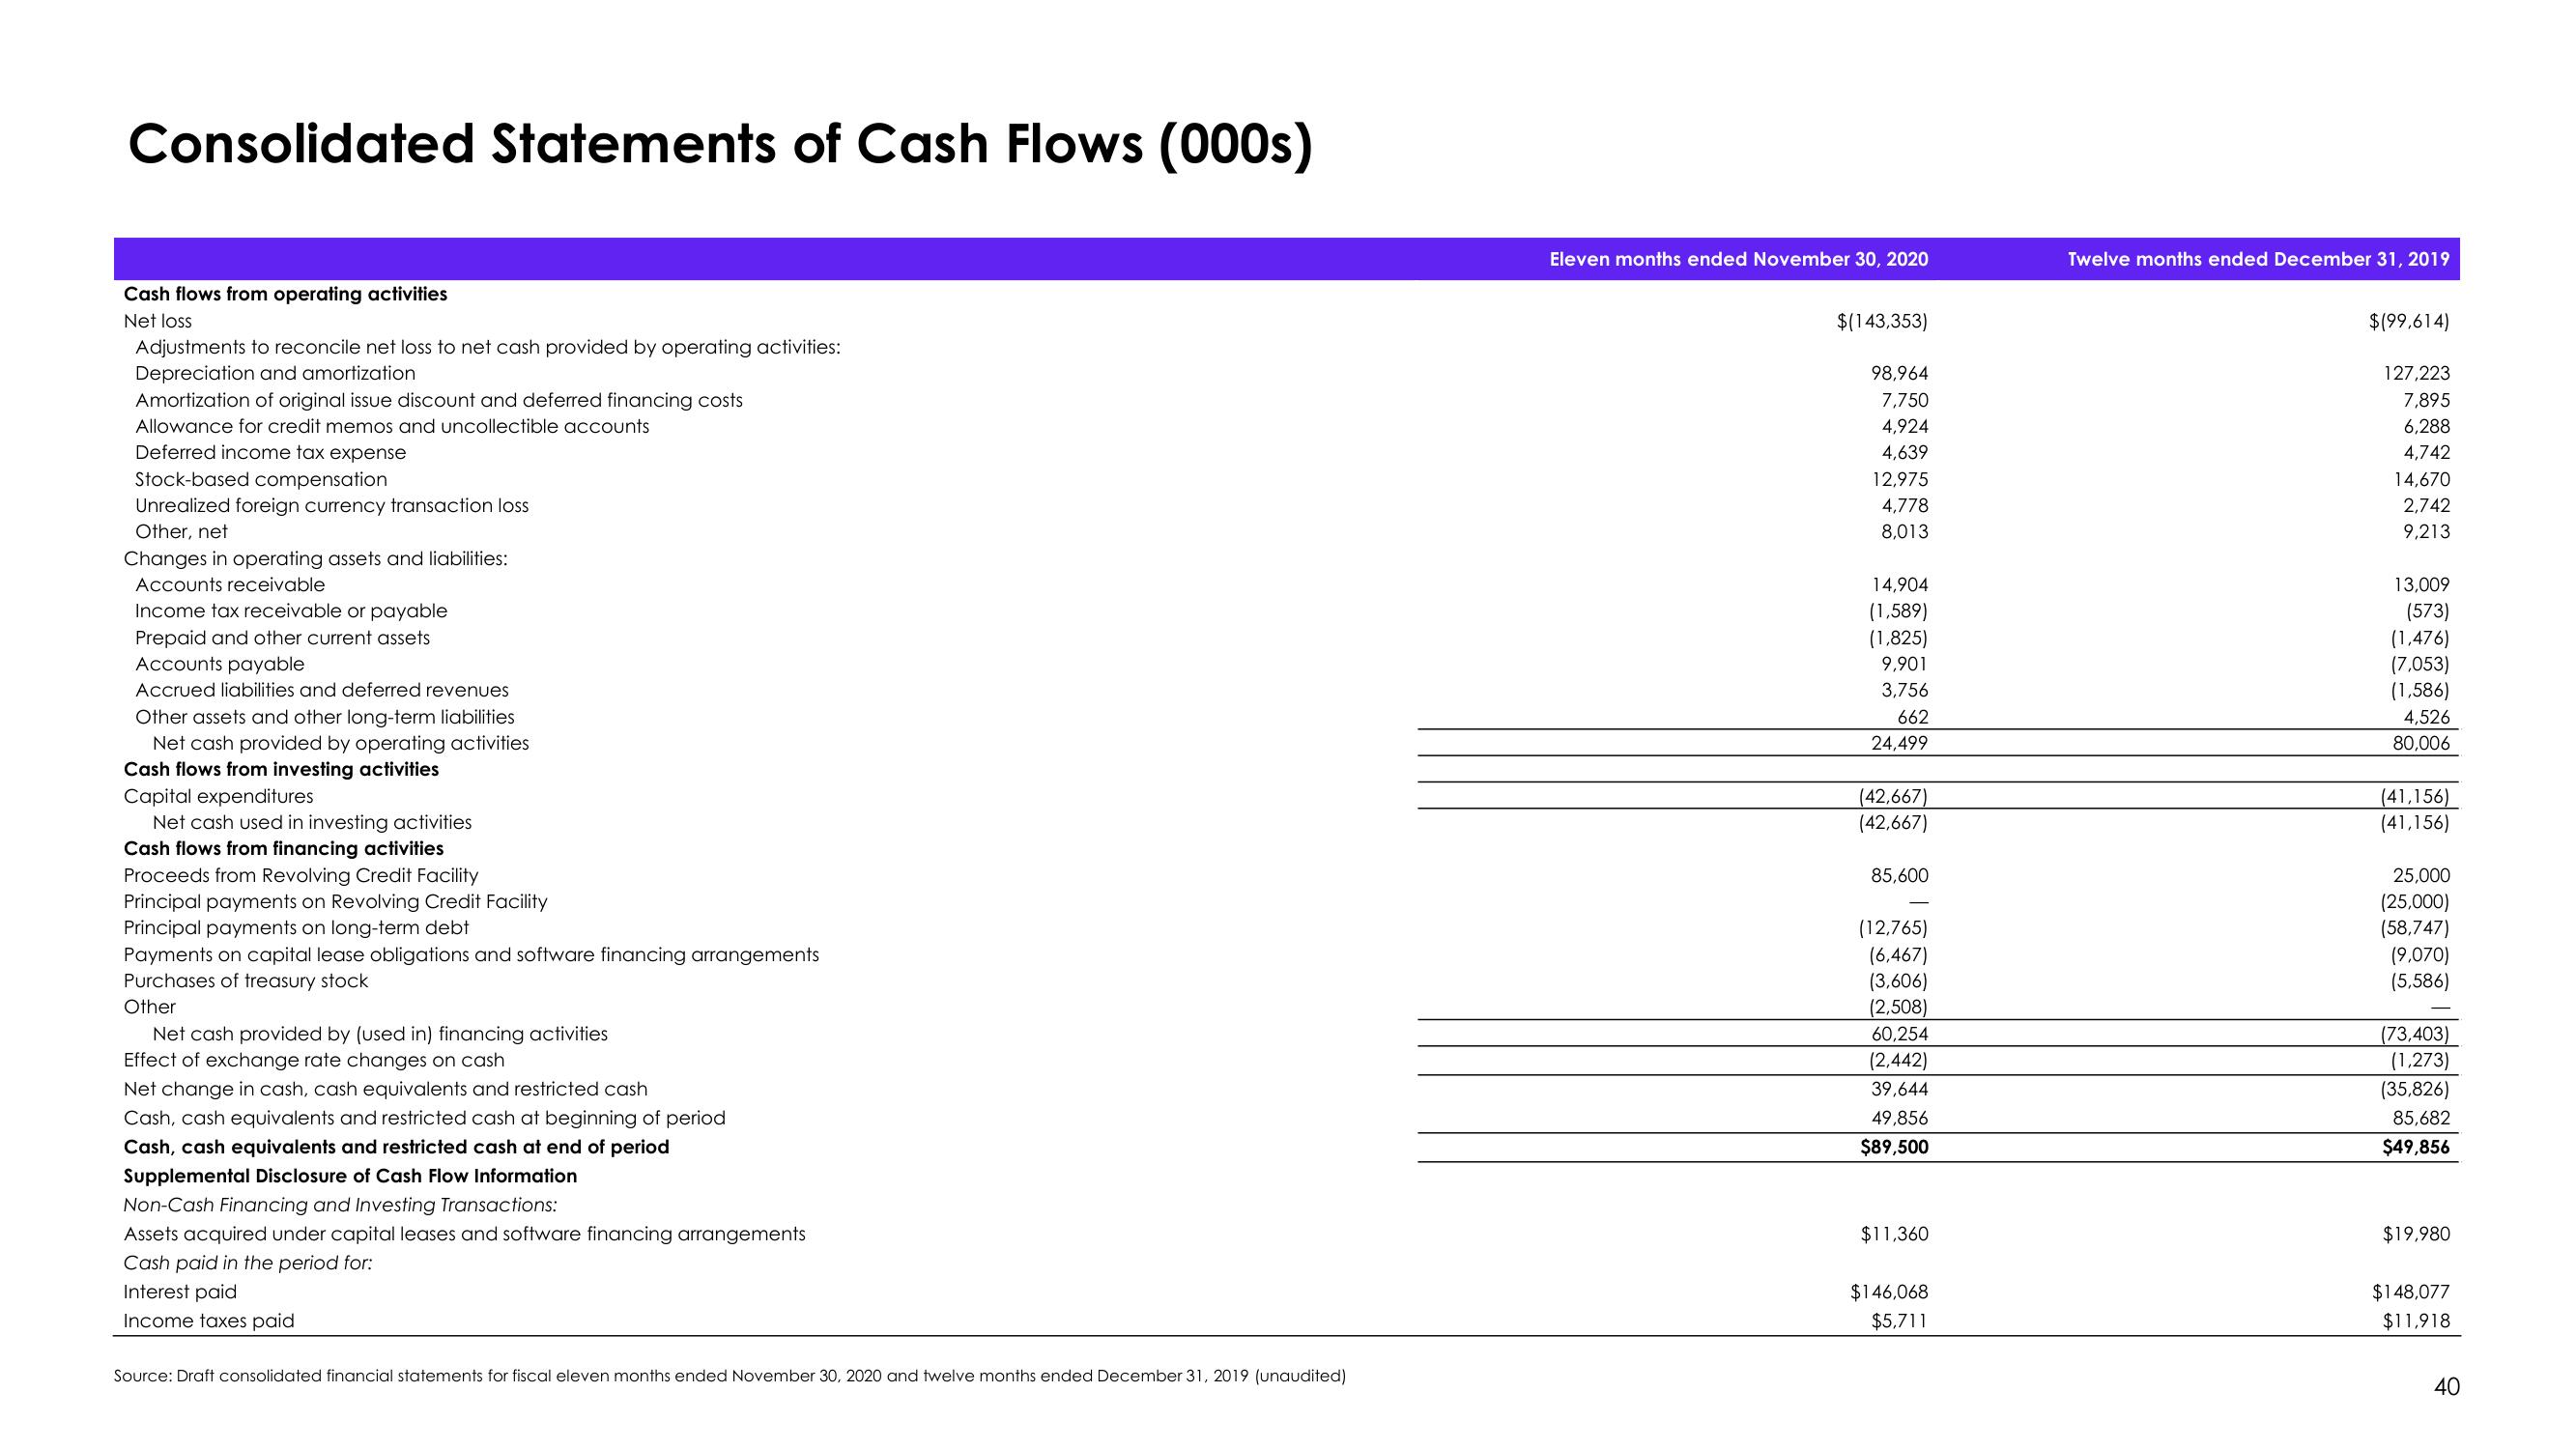
Consolidated Statements of Cash Flows (000s)
Cash flows from operating activities
Net loss
Adjustments to reconcile net loss to net cash provided by operating activities:
Depreciation and amortization
Amortization of original issue discount and deferred financing costs
Allowance for credit memos and uncollectible accounts
Deferred income tax expense
Stock-based compensation
Unrealized foreign currency transaction loss
Other, net
Changes in operating assets and liabilities:
Accounts receivable
Income tax receivable or payable
Prepaid and other current assets
Accounts payable
Accrued liabilities and deferred revenues
Other assets and other long-term liabilities
Net cash provided by operating activities
Cash flows from investing activities
Capital expenditures
Net cash used in investing activities
Cash flows from financing activities
Proceeds from Revolving Credit Facility
Principal payments on Revolving Credit Facility
Principal payments on long-term debt
Payments on capital lease obligations and software financing arrangements
Purchases of treasury stock
Other
Net cash provided by (used in) financing activities
Effect of exchange rate changes on cash
Net change in cash, cash equivalents and restricted cash
Cash, cash equivalents and restricted cash at beginning of period
Cash, cash equivalents and restricted cash at end of period
Supplemental Disclosure of Cash Flow Information
Non-Cash Financing and Investing Transactions:
Assets acquired under capital leases and software financing arrangements
Cash paid in the period for:
Interest paid
Income taxes paid
Source: Draft consolidated financial statements for fiscal eleven months ended November 30, 2020 and twelve months ended December 31, 2019 (unaudited)
Eleven months ended November 30, 2020
$(143,353)
98,964
7,750
4,924
4,639
12,975
4,778
8,013
14,904
(1,589)
(1,825)
9,901
3,756
662
24,499
(42,667)
(42,667)
85,600
(12,765)
(6,467)
(3,606)
(2,508)
60,254
(2,442)
39,644
49,856
$89,500
$11,360
$146,068
$5,711
Twelve months ended December 31, 2019
$(99,614)
127,223
7,895
6,288
4,742
14,670
2,742
9,213
13,009
(573)
(1,476)
(7,053)
(1,586)
4,526
80,006
(41,156)
(41,156)
25,000
(25,000)
(58,747)
(9,070)
(5,586)
(73,403)
(1,273)
(35,826)
85,682
$49,856
$19,980
$148,077
$11,918
40View entire presentation