DraftKings Investor Day Presentation Deck
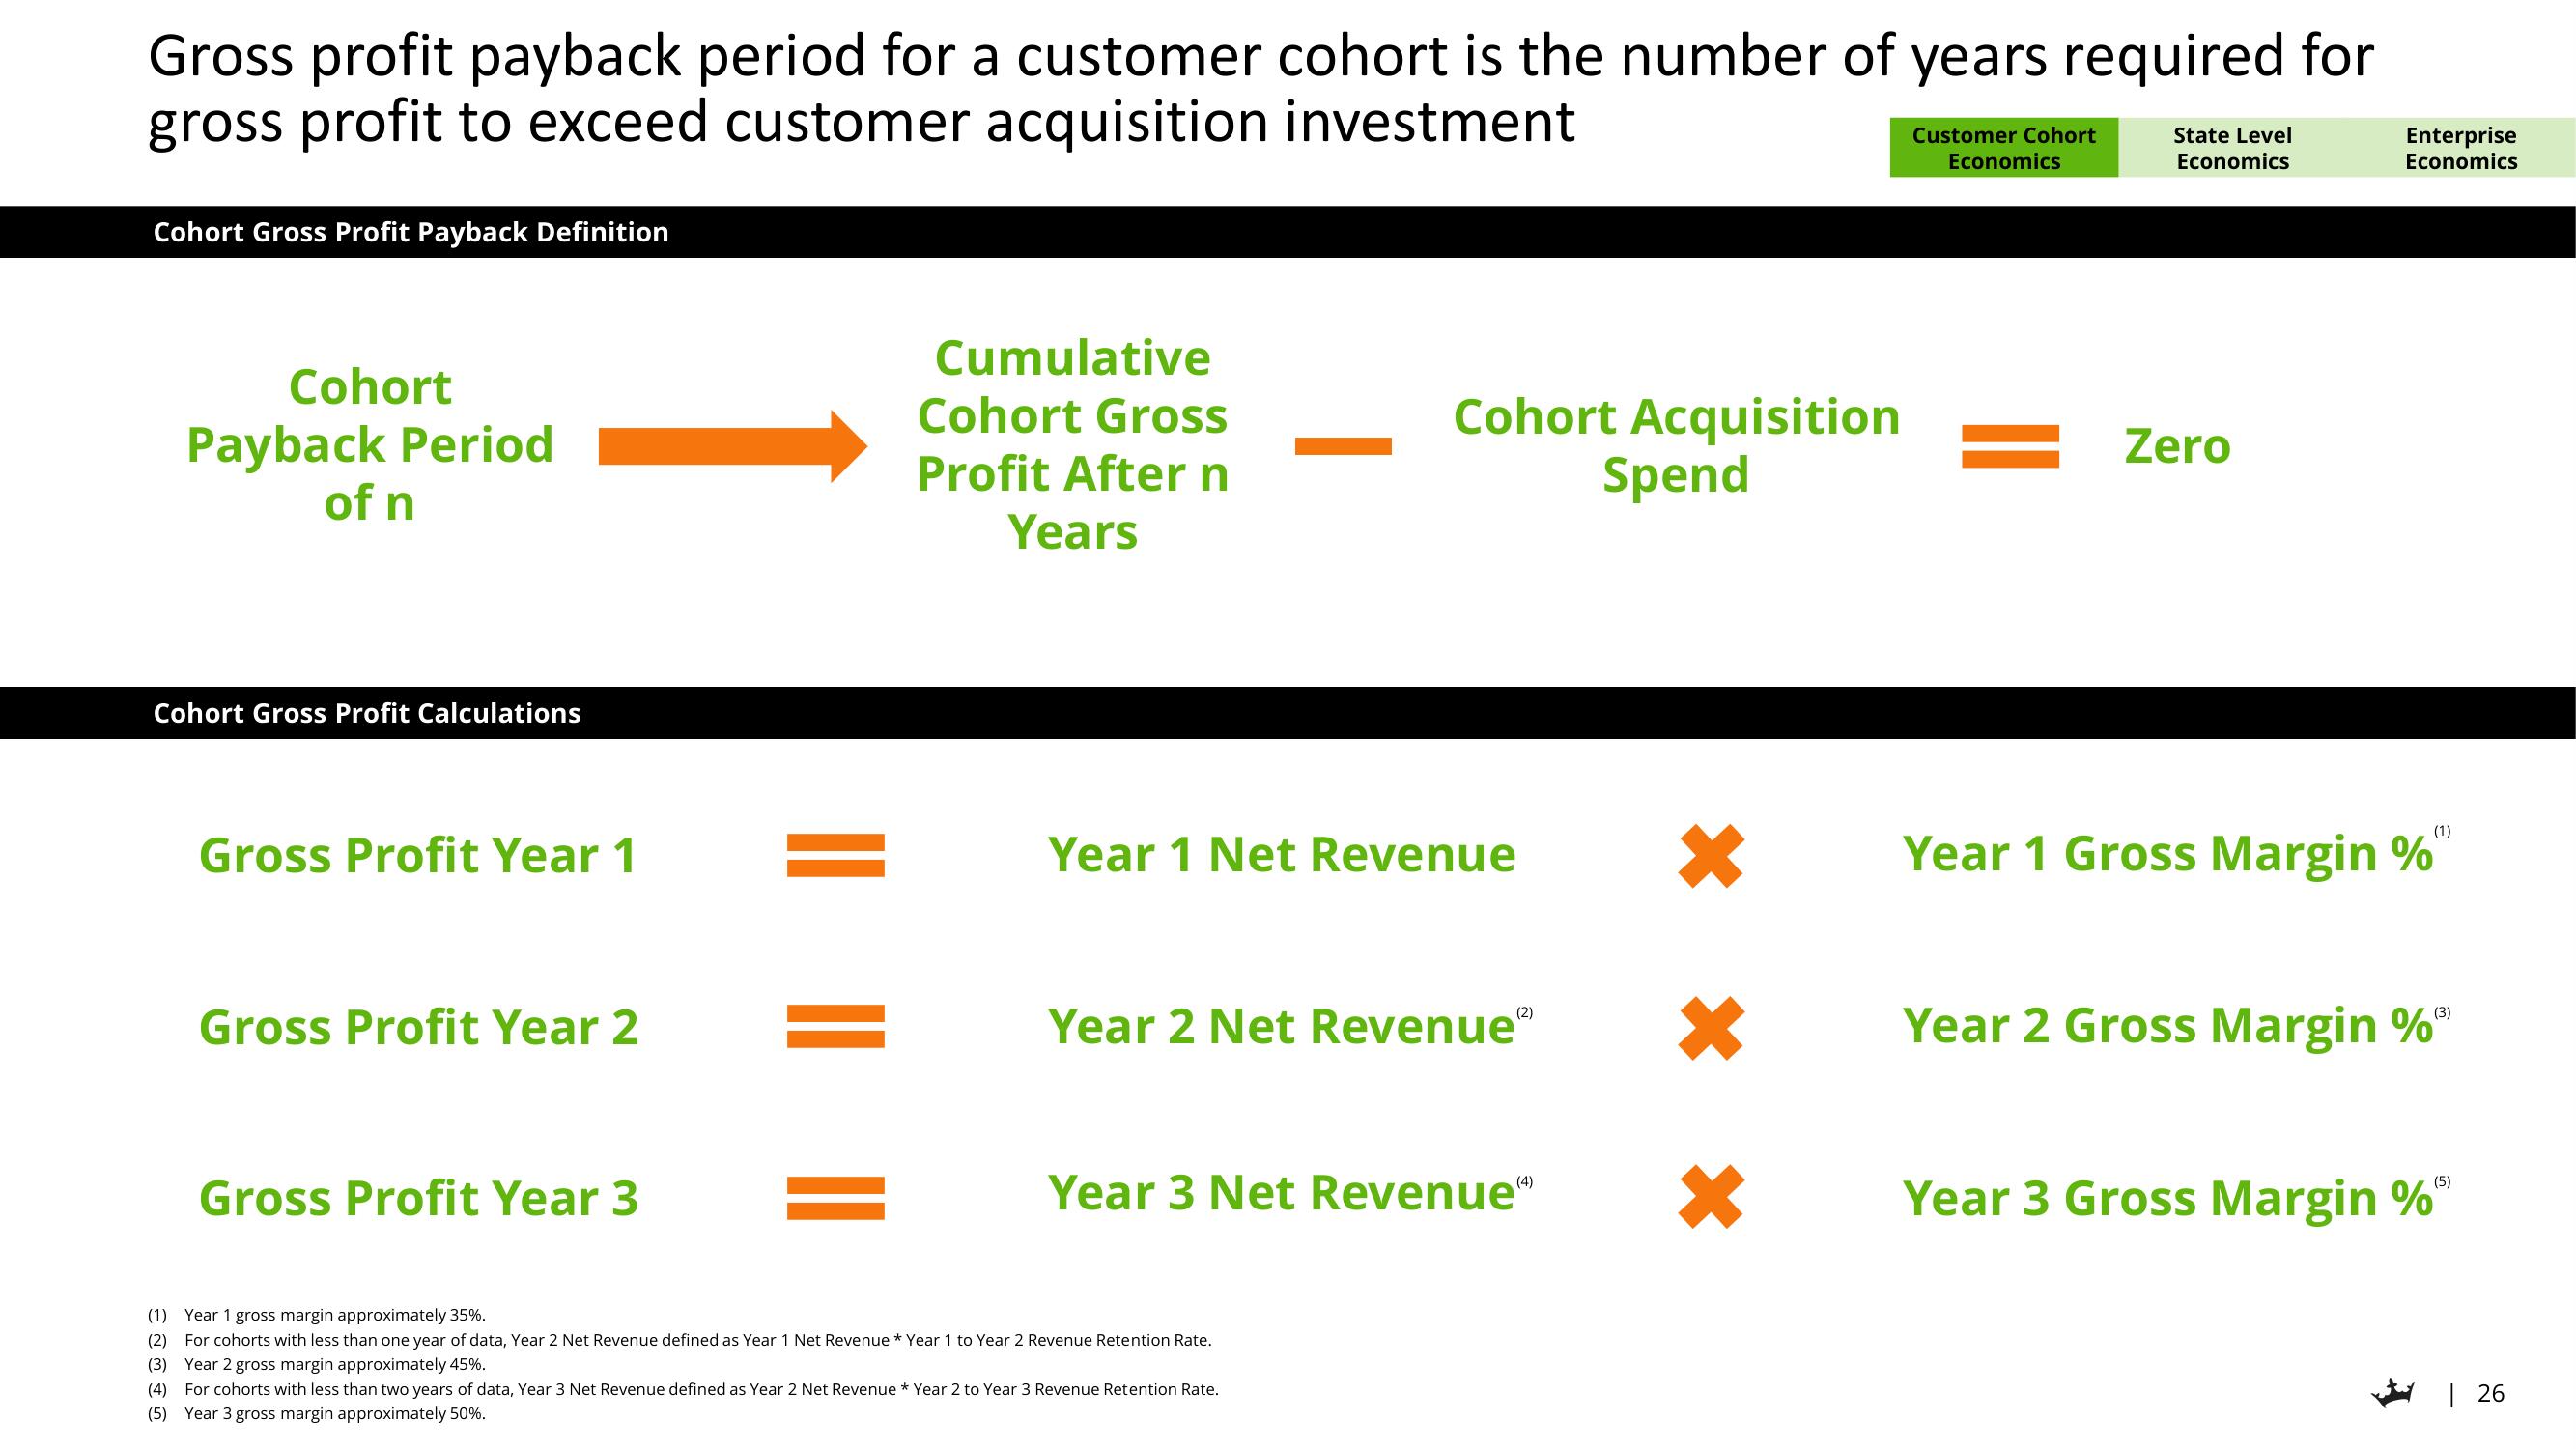
Gross profit payback period for a customer cohort is the number of years required for
gross profit to exceed customer acquisition investment
Cohort Gross Profit Payback Definition
Cohort
Payback Period
of n
Cohort Gross Profit Calculations
Gross Profit Year 1
Gross Profit Year 2
Gross Profit Year 3
Cumulative
Cohort Gross
Profit After n
Years
Cohort Acquisition
Spend
Year 1 Net Revenue
Year 2 Net Revenue®
Year 3 Net Revenue"
(1) Year 1 gross margin approximately 35%.
(2) For cohorts with less than one year of data, Year 2 Net Revenue defined as Year 1 Net Revenue * Year 1 to Year 2 Revenue Retention Rate.
(3) Year 2 gross margin approximately 45%.
(4) For cohorts with less than two years of data, Year 3 Net Revenue defined as Year 2 Net Revenue *Year 2 to Year 3 Revenue Retention Rate.
(5) Year 3 gross margin approximately 50%.
*
*
*
Customer Cohort
Economics
State Level
Economics
Zero
Enterprise
Economics
(1)
Year 1 Gross Margin %
(3)
Year 2 Gross Margin %Ⓡ
(5)
Year 3 Gross Margin %
| 26View entire presentation