Better SPAC Presentation Deck
Building the leading integrated
homeownership platform
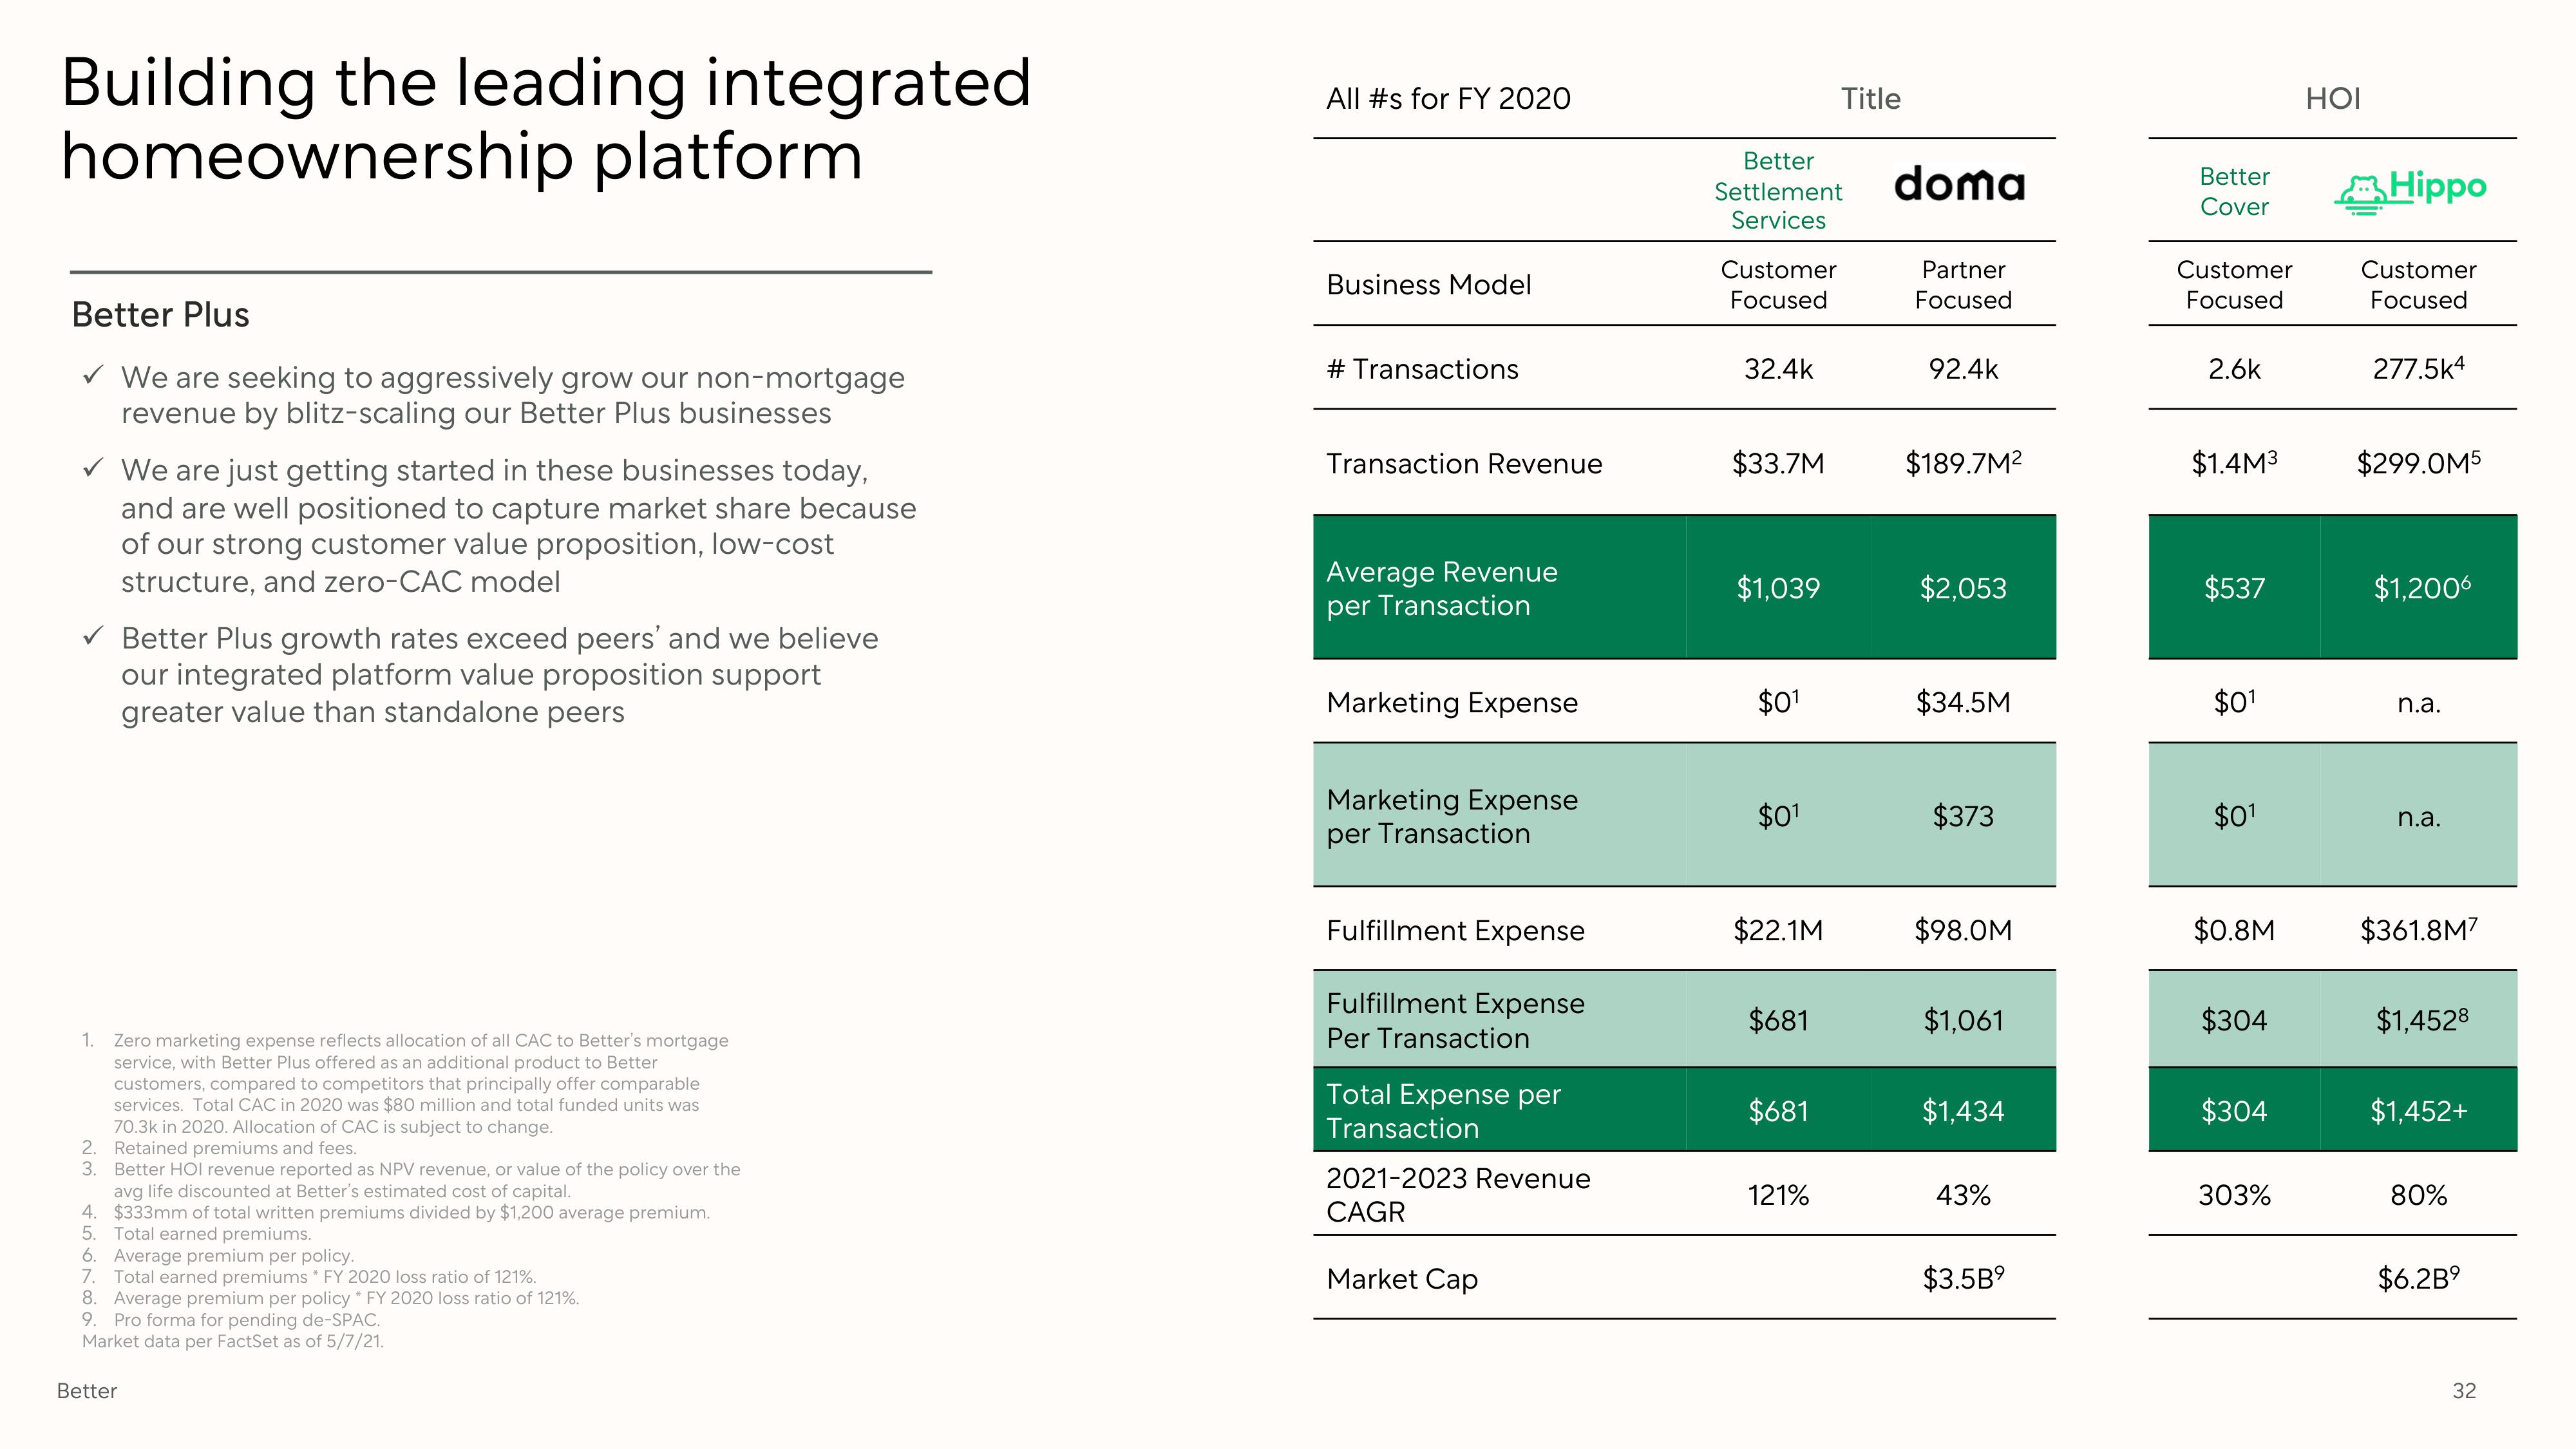
Better Plus
✓ We are seeking to aggressively grow our non-mortgage
revenue by blitz-scaling our Better Plus businesses
✓ We are just getting started in these businesses today,
and are well positioned to capture market share because
of our strong customer value proposition, low-cost
structure, and zero-CAC model
Better Plus growth rates exceed peers' and we believe
our integrated platform value proposition support
greater value than standalone peers
1. Zero marketing expense reflects allocation of all CAC to Better's mortgage
service, with Better Plus offered as an additional product to Better
customers, compared to competitors that principally offer comparable
services. Total CAC in 2020 was $80 million and total funded units was
70.3k in 2020. Allocation of CAC is subject to change.
2. Retained premiums and fees.
3. Better HOI revenue reported as NPV revenue, or value of the policy over the
avg life discounted at Better's estimated cost of capital.
4. $333mm of total written premiums divided by $1,200 average premium.
5. Total earned premiums.
6. Average premium per policy.
7. Total earned premiums * FY 2020 loss ratio of 121%.
8. Average premium per policy * FY 2020 loss ratio of 121%.
9. Pro forma for pending de-SPAC.
Market data per FactSet as of 5/7/21.
Better
All #s for FY 2020
Business Model
# Transactions
Transaction Revenue
Average Revenue
per Transaction
Marketing Expense
Marketing Expense
per Transaction
Fulfillment Expense
Fulfillment Expense
Per Transaction
Total Expense per
Transaction
2021-2023 Revenue
CAGR
Market Cap
Better
Settlement doma
Services
Customer
Focused
32.4k
$33.7M
$1,039
$01
$0¹
$22.1M
$681
$681
Title
121%
Partner
Focused
92.4k
$189.7M²
$2,053
$34.5M
$373
$98.0M
$1,061
$1,434
43%
$3.5B⁹
Better
Cover
Customer
Focused
2.6k
$1.4M³
$537
$01
$0¹
$0.8M
$304
$304
303%
HOI
Hippo
Customer
Focused
277.5k4
$299.0M5
$1,2006
n.a.
n.a.
$361.8M7
$1,4528
$1,452+
80%
$6.2B⁹
32View entire presentation